Click here for Code and Results
Abstract
In this study, we built a Question-Answering (QA) system for COVID related questions using two BERT models BERT base and BioBERT in order to compare the predictions and explore if pretraining with medical articles is effective and how the attention mechanism differs between the two models. Our first experiment used cosine-similarity based reader-retriever architecture to get the context for the QA model from a pool of more than 40 thousand research articles. For our second experiment, we used two different SQuAD format datasets to finetune BERT and BioBERT to compare their performance. We visualized the attention matrices for BERT and BioBERT in both experiments. In addition, we also measured the CO2 emission in grams per model for a few different BERT models to explore if a 100% accurate model is holistically always the best
1 Introduction
BERT (Biderictional Encoder Representations from Transformers) is a transformers based language representation model [1] that has broken many records for how well the models can handle language-based tasks. The pre-trained BERT models can be utilized for many downstream tasks such as Natural Language Inference, Named Entity Recognition, Question Answering / Reading Comprehension.
We have implemented and experimented with two different BERT models, BERT base and BioBERT in this study to understand their attention mechanism with respect to one of the downstream tasks, Question Answering (QA). We built a QA system for answering COVID related questions utilizing the research articles available via CORD-19 on Kaggle [2]. In addition to comparing the accuracy scores between the models, we also visualized the attention matrices for both the models. We also wanted to explore how the models would perform on an out-of-domain dataset, especially how a model like BioBERT that is pretrained on medical articles would answer questions from a different domain and explore how the performance varies before and after fine-tuning the models.
All the technological advancements made possible by artificial intelligence, such as voice recognition and self-driving cars, come with a cost: these systems use a lot of energy and potentially produce a lot of greenhouse gas emissions. The main truth is that AI already has a sizable carbon footprint, and if current market trends continue, it will soon get much worse. So inorder to compare models and accuracies, and talk more about different accuracy metrics that can be introduced to consider carbon footprint of the models, we conduct an experiment where we take 6 pretrained models and run queries to perform a comparative study of their runtime, CO2 emissions and accuracies.
2 Approach
2.1 BERT Architecture
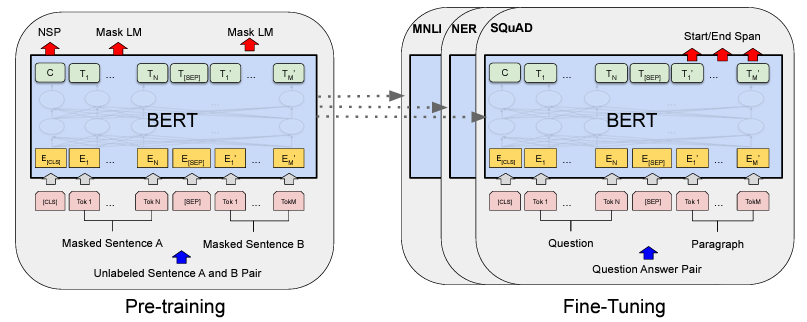
BERT is based on Transformers, trained using the Transformer Encoder architecture, with Maked Language Model (MLM) and Next Sentence Prediction (NSP) pre-training objectives. There are two steps in the framework, pre-training and fine-tuning.
|
Fine-tuning of BERT takes much less time than pre-training the models. In fact, the recommended number of epochs for fine-tuning for small datasets is 2-4 [1]. The authors have also observed that large datasets (100k+ examples) are far less sensitive to hyperparameters than datasets of small size.
2.2 BERT for Question-Answering
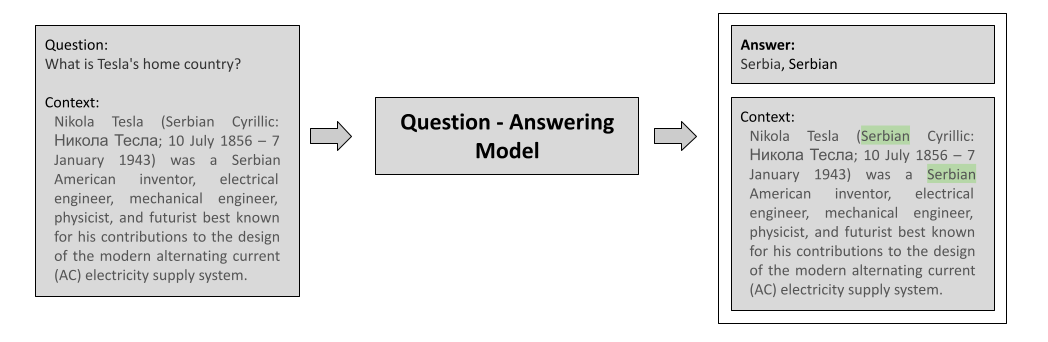
There are essentially two variations of the QA task, Extractive QA and Generative QA. In Extractive QA, the model extracts answer from a given context. This is similar to Reading Comprehension. The model identifies answers as spans of text within the context [3]. In Generative QA, the model generates answers as free text based on the given context and there is also a variant where context is not given. The encoder only models like BERT perform better in the case of extractive QA than generative QA.
The QA models can also be differentiated based on the domain the questions are answered from. In closed domain, the questions and answers are restricted to a specific domain like in this study where a QA system for COVID related questions is built. In open domain, there is no such domain restriction.
|
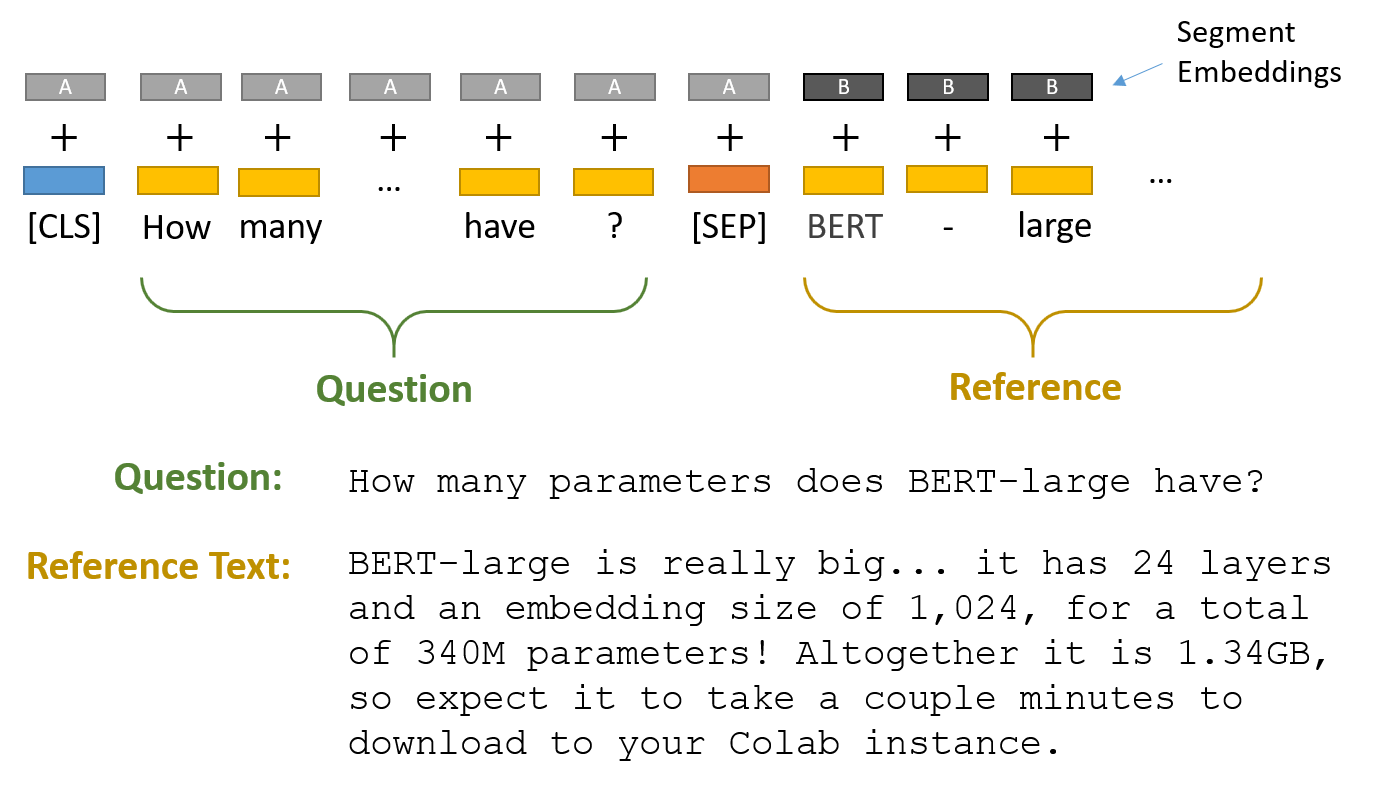
To perform the QA task we need to add a question-answering head on top of the pre-trained BERT model to find the start token and end token of an answer in a given paragraph. The question and the reference context are packed together and passed to the model. The two pieces of texts are separated by the [SEP] token. We can use BERT’s tokenizers (we have utilized the Hugging Face’s implementation of tokenizers for our experiments) to create these special tokens.
|
We can achieve the essential step of assigning numerical values to words using a tokenizer. All the words can be represented by unique indices and an embedding is a vector for each index. Tokenizer splits strings into substrings, converts strings to ids and back, adds and manages special tokens [5]. Every sequence of text starts with the special classification token [CLS] and sentences in a text sequence are separated by the [SEP] token. BERT uses “wordpiece” embeddings where the words are divided into a limited set of sub-word units [6]. This helps the model handle unfamiliar words by breaking them down into familiar words. The output embedding of every token in the text is fed into the QA head.
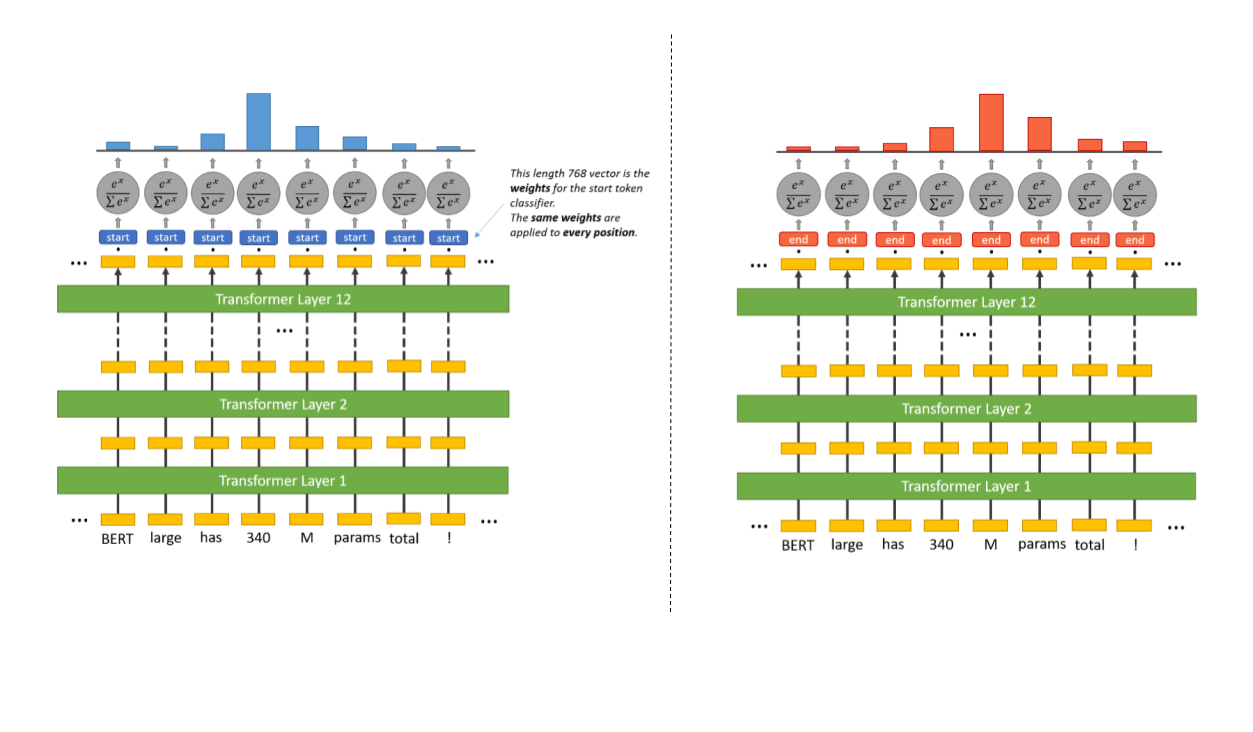
In extractive QA, as we need to highlight the span of the answer within the text, this is represented as predicting the probabilities for each token being the start token and the end token of the answer. Inside the question answering head there are two sets of weights, one for the start token and another for the end token. They have the same dimensions as the output embeddings. The final embedding of every token in the text is fed into the start token classifier. Dot product between the ‘start’ weights and the word embeddings are computed then softmax activation function is applied to obtain a probability distribution over all the words. The word with the highest probability is selected as the ‘start’ token. The same process is repeated to obtain the ‘end’ token with the ‘end’ token weights.
|
2.3 SQuAD format
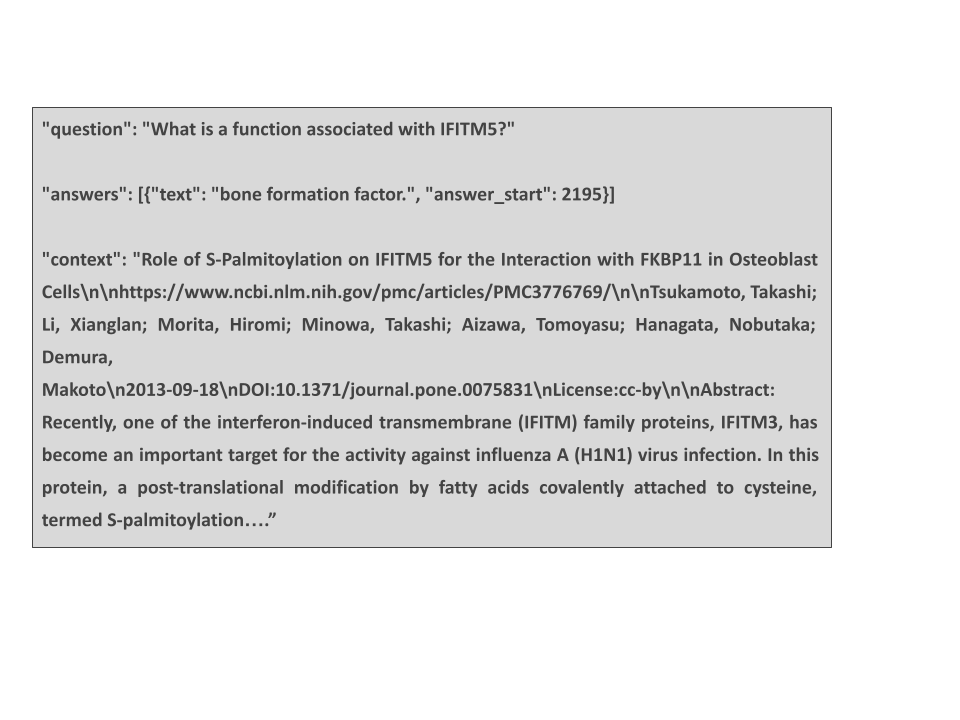
The Stanford Question Answer Dataset (SQuAD) is a reading comprehension dataset [7] consisting of questions based on Wikipedia articles. The answer to each question is span of text in the given context passage.
|
We require a dataset in this format for BERT-QA models, with context to be able to highlight the span of answer. Creating a dataset like this requires annotation of answers in the context passage. There are few datasets available on Hugging Face in SQuAD format such as COVID-QA, DuoRC and DROP-QA that we have used for our experiments.
3 Background
Our initial experiment is motivated by the research work published by Alzubi et, al where they have proposed COBERT, a COVID-19 Question Answering System Using BERT. COBERT has a retriever-reader architecture where the answers are predicted by searching a corpus of corona virus-related literature made accessible through the Coronavirus Open Research Dataset Challenge (CORD-19) [8].
In their proposed system, the retriever is a TF-IDF vectorizer that captures the top 500 documents with optimal scores. The second component, reader is a pre-trained BERT model on SQuAD 1.1 dev dataset refines the sentences from the filtered documents. These sentences are then passed into a ranker which compares the logits scores to produce a short answer, title of the paper and source article of extraction. The authors had also prepared a list of queries and answers for testing the models.
We have followed a similar architecture for retrieving the answers from contexts. In addition to BERT base we have also used BioBERT to predict the answers. Lee et. al [9] introduced the BioBERT model where they have adapted the pre-trained language model BERT for biomedical corpora from PubMed and PMC. For testing the models, we have used COVID-QA [10], a SQuAD format dataset built using the CORD-19 dataset. The dataset has 2019 question-answer pairs formed based on articles mostly related to COVID-19 selected from CORD-19 and annotated by biomedical experts in SQuAD style fashion.
3.1 Cosine Similarity based context selection
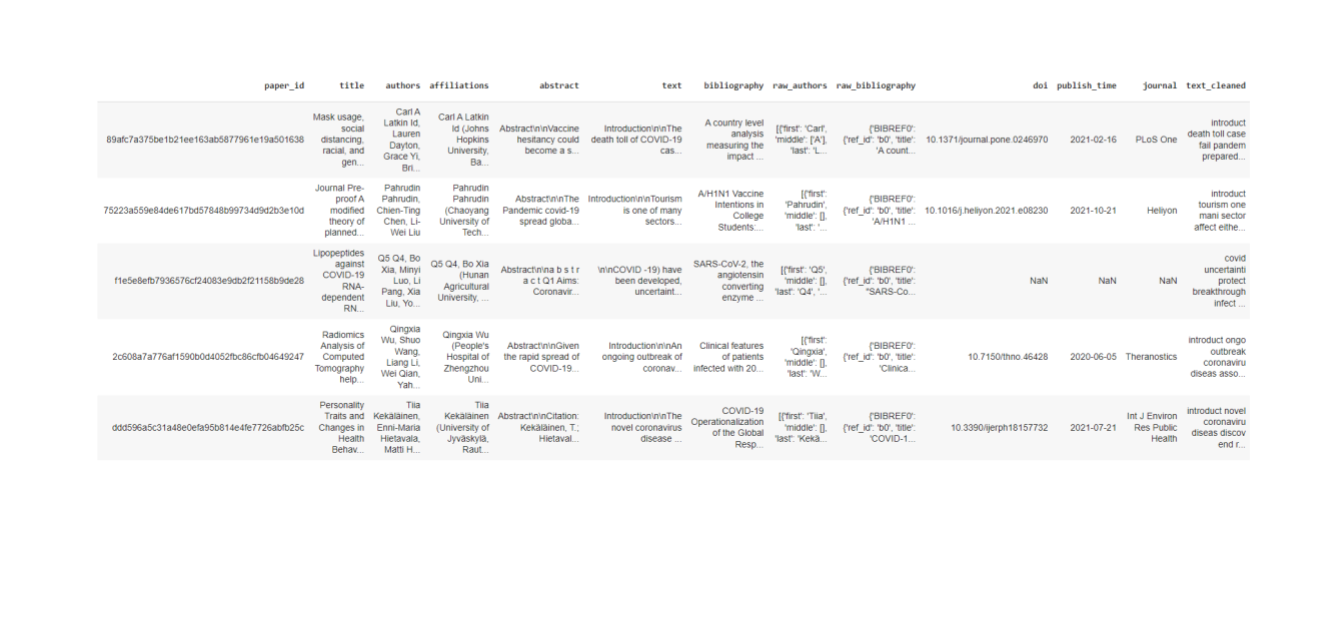
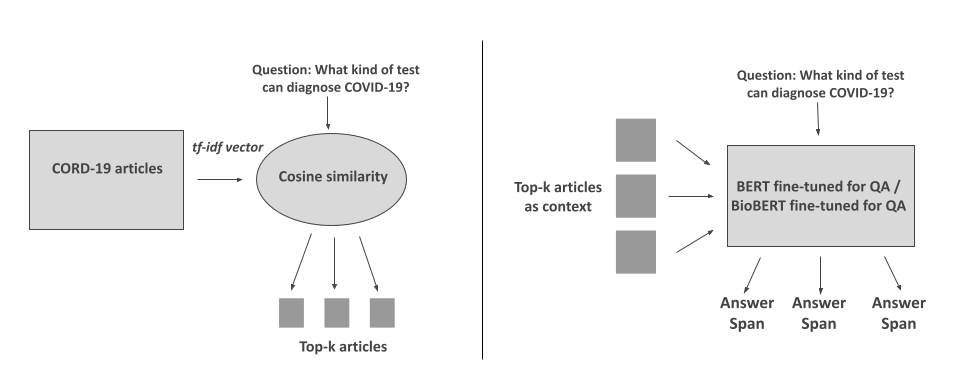
Our pipeline has two parts, Retriever and Reader as shown in figure 7. Firstly, we processed the corona virus related literature as follows,
- Filtered the most relevant articles, i.e., we considered only the articles containing the following keywords - 'novel coronavirus', 'novel-coronavirus', 'coronavirus-2019', 'sars-cov-2', 'sarscov2', 'covid-19', 'covid19', '2019ncov', '2019-ncov', 'wuhan', since CORD-19 is a resource of over 1,000,000 scholarly articles, including over 400,000 with full text and using all of the articles would be time-consuming
- Converted all words to lowercase, removed numbers, punctuations, and stopwords, and stemmed all words
|
We created a dataframe with the cleaned text as one of the columns along with the metadata of the papers.
|
Next phase is retrieval. Here we pass the question and the processed COVID-19 related literature. We pass the text through a TF-IDF vectorizer. Term Frequency (TF) is the number of occurrences of a term in a document. This is an indicator of the importance of a term in a document.
Inverse Document Frequency (IDF) is a proportion of the data the word gives i.e., it is the weight of a term. The weight is reduced if the occurrence of the term is scattered throughout all the documents.
Then the metric tf-idf is computed as [12],
tf-idf(t, d) = tf(t, d) * idf(t) -------------------------------------- (1)
and idf is computed as
idf(t) = log [ n / df(t) ] + 1 ---------------------------------------- (2)
Then we compute the cosine similarity between the query and the articles in our corpus. In this experiment, we picked the top 20 articles based on cosine similarity. We pass the query and the top 20 articles as contexts into the reader which is a BERT model.
cosine similarity(A, B) = dot product(A, B) / (||A||*||B||) ---------------------------------------- (3)
where A and B are text vectors.
We pass the query and the top 20 articles as contexts into the reader which is a BERT model with a Question-Answering head. The model predicts an answer for each of the context passed. Since we used the COVID-QA dataset for questions/contexts/answers, we don’t have an actual ground truth and so we did not compute an Exact Match score or F1 score in this case. Instead, we used a similarity score called METEOR score to measure the similarity between the predicted answer and the answer available in the COVID-QA dataset. METEOR metric is based on unigrams matching between the two texts compared based on their surface forms, stemmed forms, and meanings [11].
3.2 Out-of-domain testing on BERT models
In our second experiment, we wanted to explore how the BERT models performed on out-of-domain data. Among the limited number of datasets available in the SQuAD format, we have built QA models with the COVID-QA [13] data and DROP-QA data. Both datasets are available on Huggingface. DROP-QA [14], Reading Comprehension Benchmark Requiring Discrete Reasoning Over Paragraphs is a benchmarking dataset in which the that requires a more comprehensive understanding of the contexts to operate on the text than the prior datasets. We measured the performance before and after fine-tuning for both the datasets. We computed EM and F1-scores and visualized the attention matrices in all the cases.
4 Results
All our codes and results are available here.
The models we used for our experiments are BERT base and BioBERT, both fine-tuned on SQuAD 1.1.
BERT base has 12 layers, 12 attention heads and has 110M parameters. The version of the BioBERT model used is a BERT base model as well pre-trained on PubMed articles. We were able to use the models available on Hugging Face,
- Seongkyu/bert-base-cased-finetuned-squad
- gerardozq/biobert_v1.1_pubmed-finetuned-squad
For visualizing the attention matrices, we have utilized the Captum interpretability library [15].
4.1 METEOR scores and attention visualization
As explained previously, we did not measure EM/F1 scores for our first experiment. Instead we extracted the answers for a few questions and computed METEOR score for the extracted answer. Then we visualized the attention matrix for one of the questions.
All the steps are same for both the models. We first passed the query and the document corpus to get the top 20 contexts. Then passed the contexts to the BERT-QA model to get the answers. Then compared the extracted answer to the answer available in COVID QA. We repeated the same steps for both models before and after fine-tuning on COVID-QA. We fine-tuned on COVID-QA for 3 epochs.
4.1.1 BERT base without fine-tuning on COVID-QA
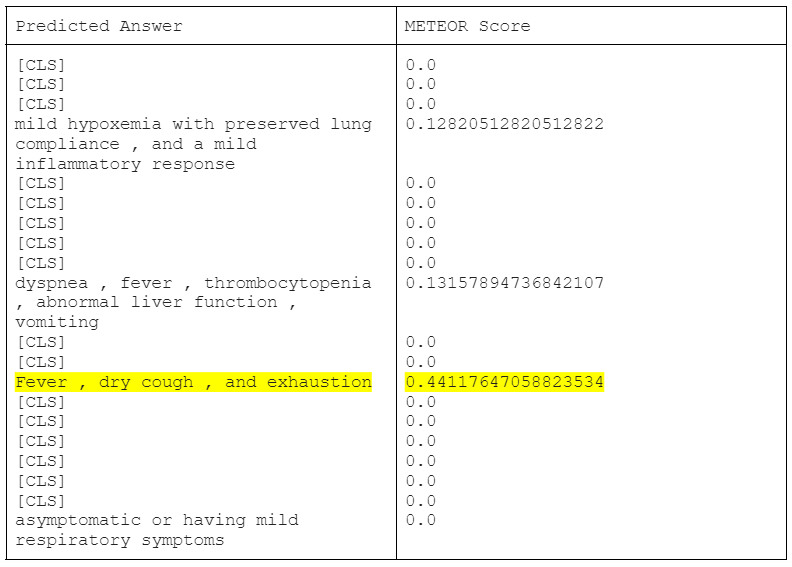
Our first model is BERT base fine-tuned on SQuAD but not fine-tuend on COVID-QA. Let us take a look at a few examples,
Example 1
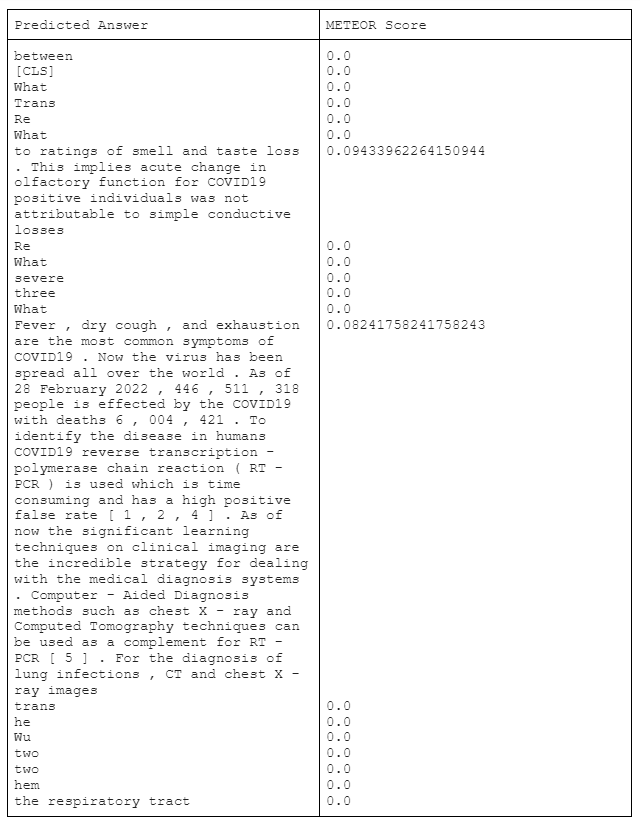
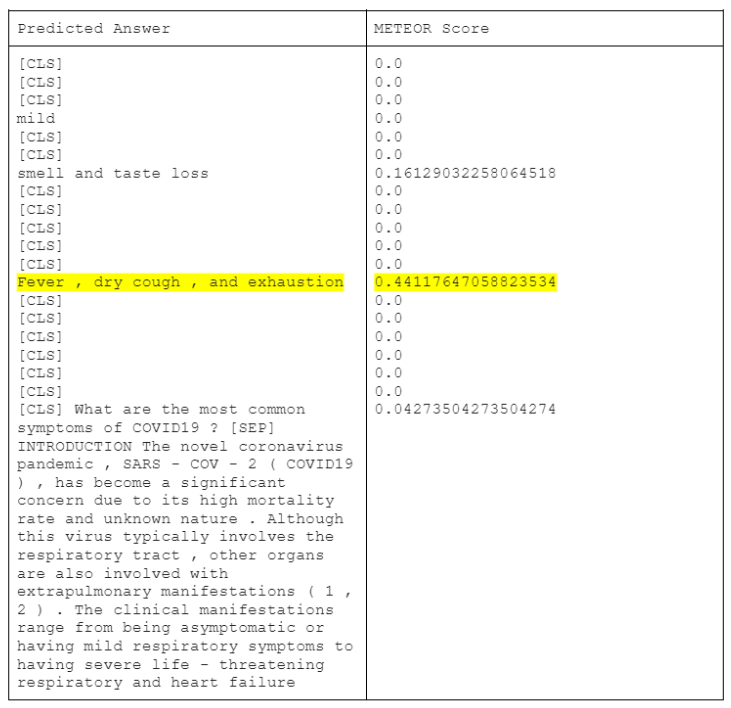
Question: What are the most common symptoms of COVID19?
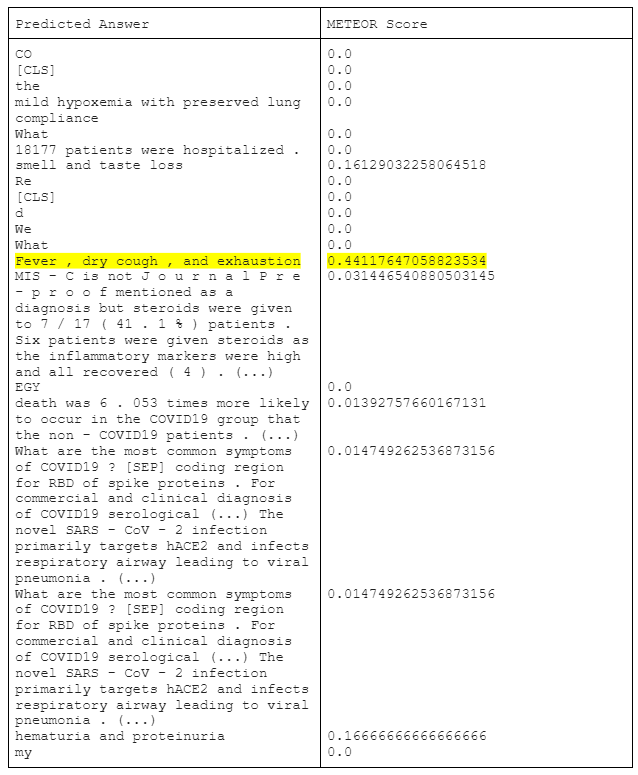
Answer and METEOR Score: (20 answers predicted from the 20 contexts)
Answer in COVID-QA: Fever and cough
|
Example 2
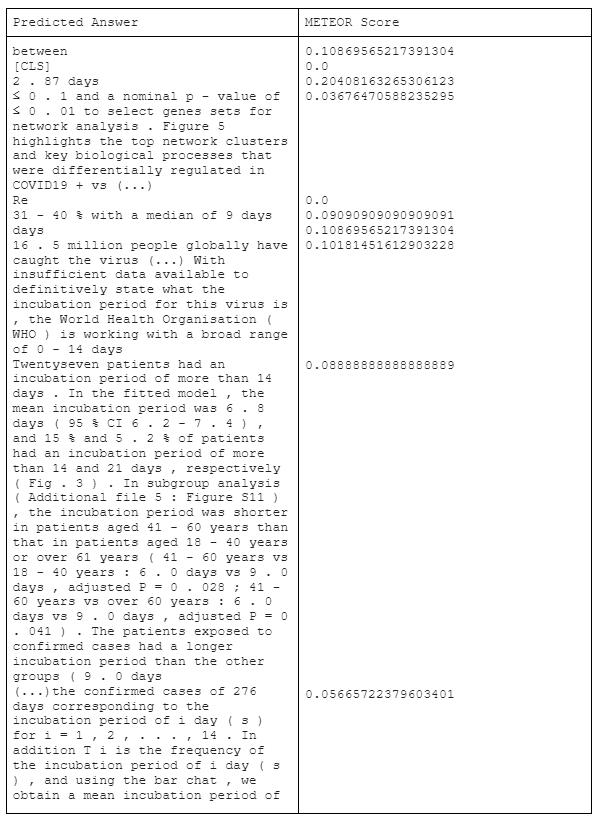
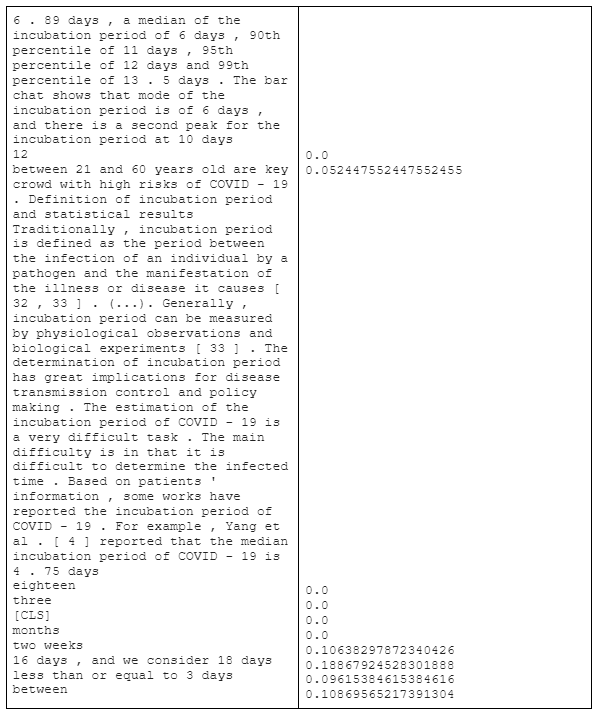
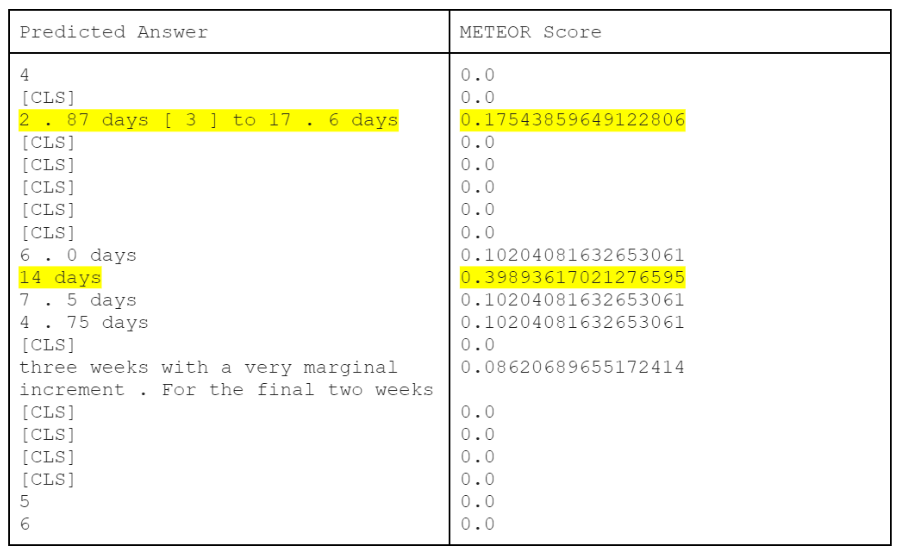
Question: How long is the incubation time for COVID19?
Answer and METEOR Score: (20 answers predicted from the 20 contexts)
Answer in COVID-QA: between 2 and 14 days
|
The contexts are different, i.e., the context selected by cosine similarity is different from the context chosen in the annotated COVID-QA dataset which is causing the difference in the answers.
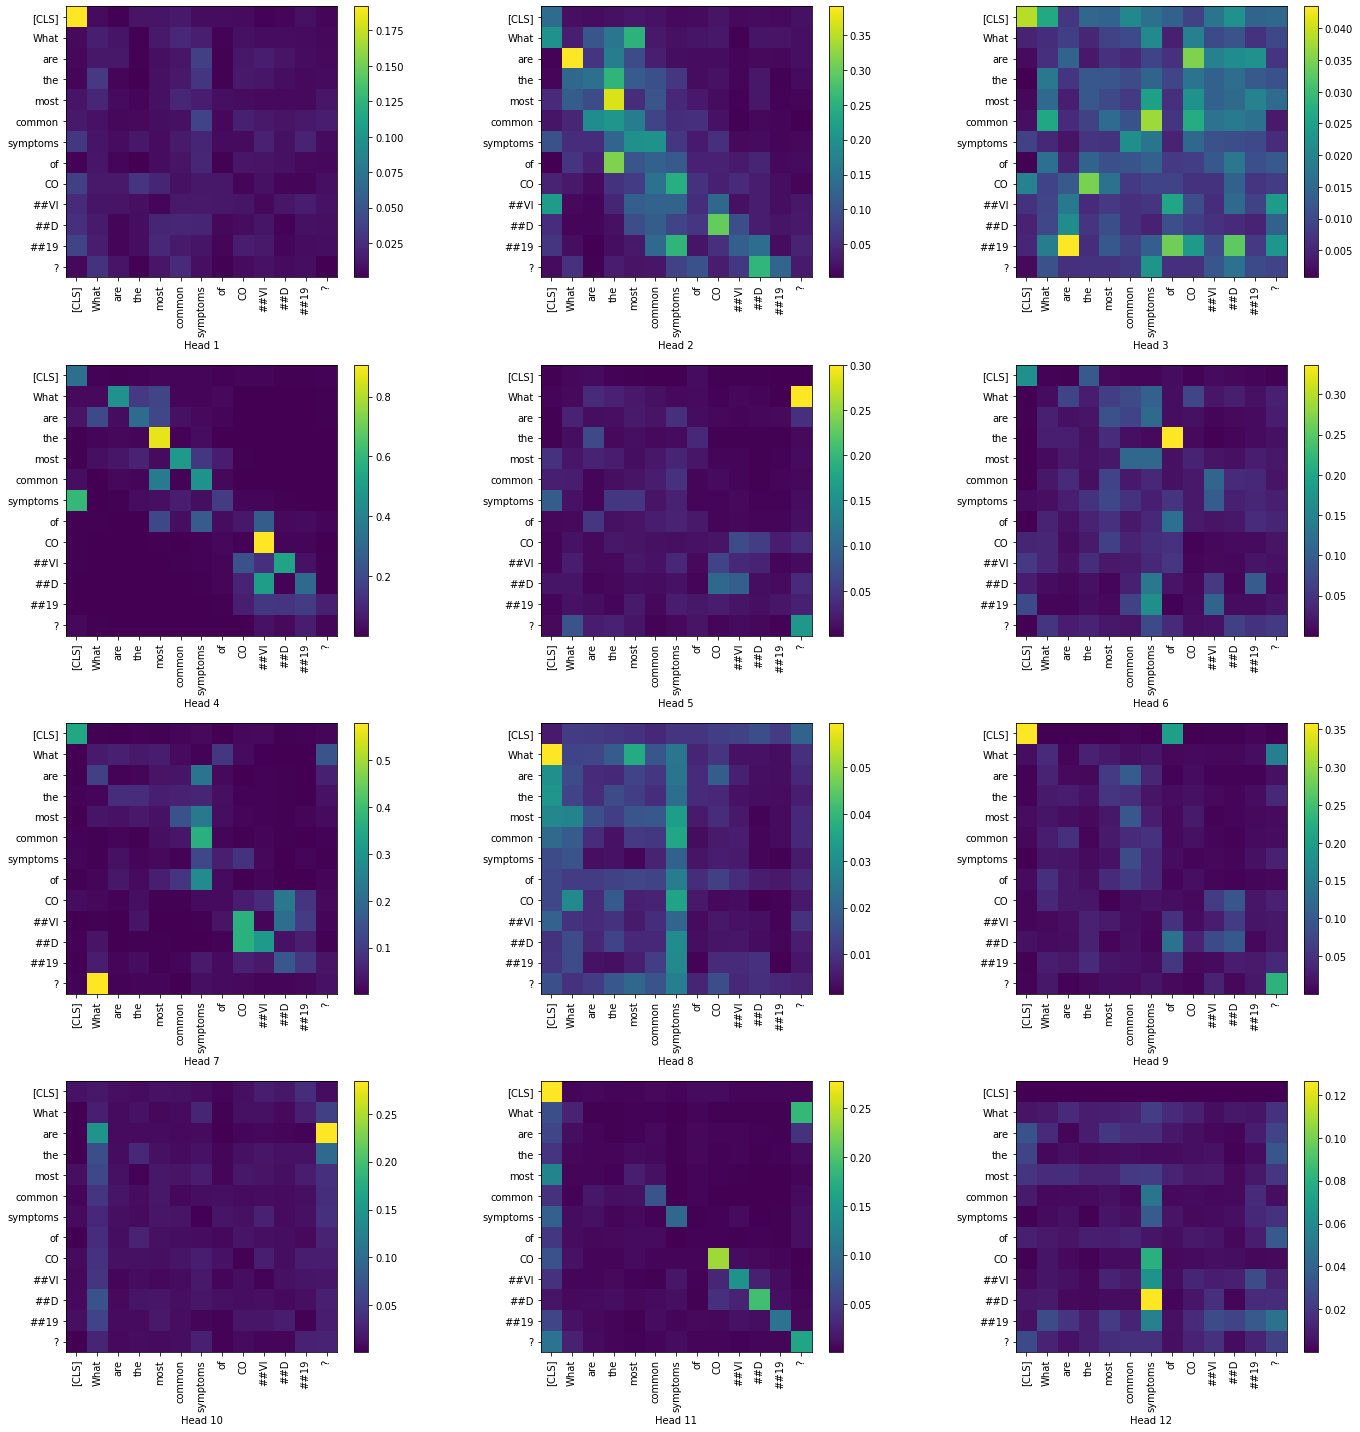
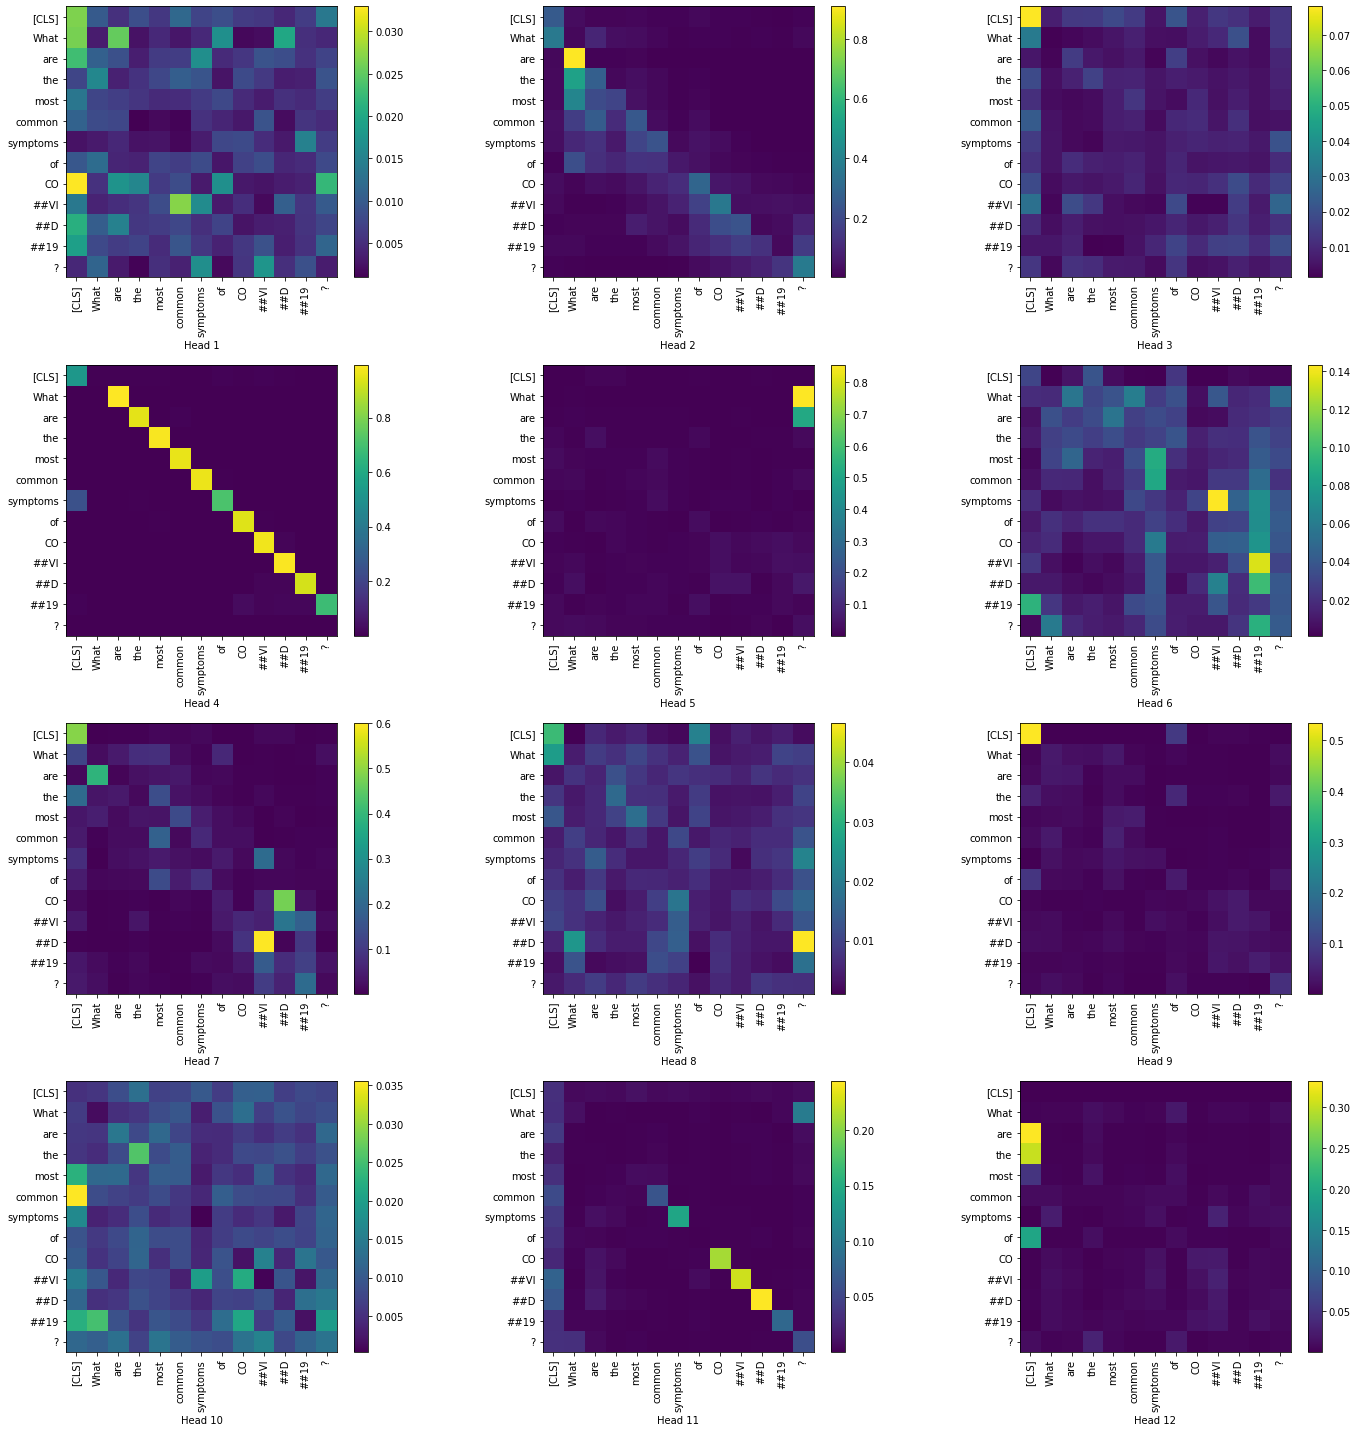
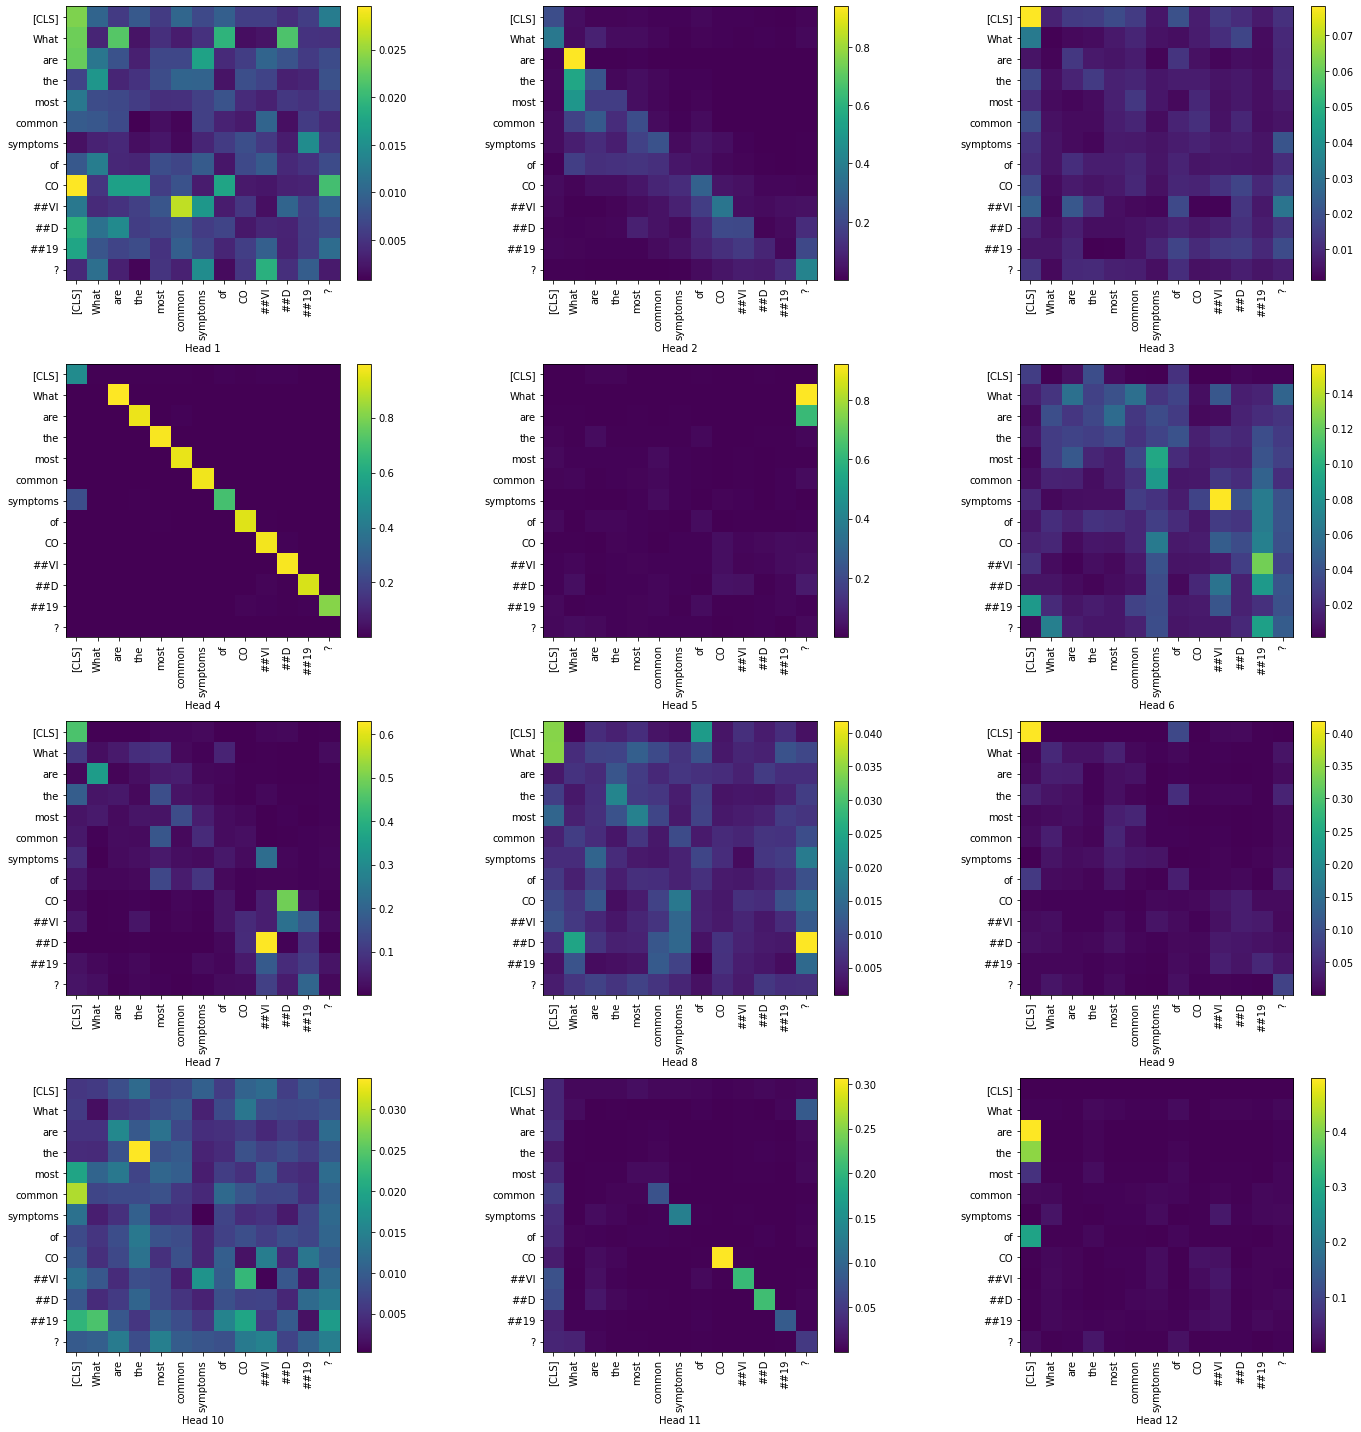
Now let us visualize the attention matrices. The output_attentions represent the attention probabilities of all 12 layers and 12 heads. It is the softmax-normalized dot-product between the key and query vectors. According to [16], it has been used as an importance indicator of how much a token attends to another token in the given text.
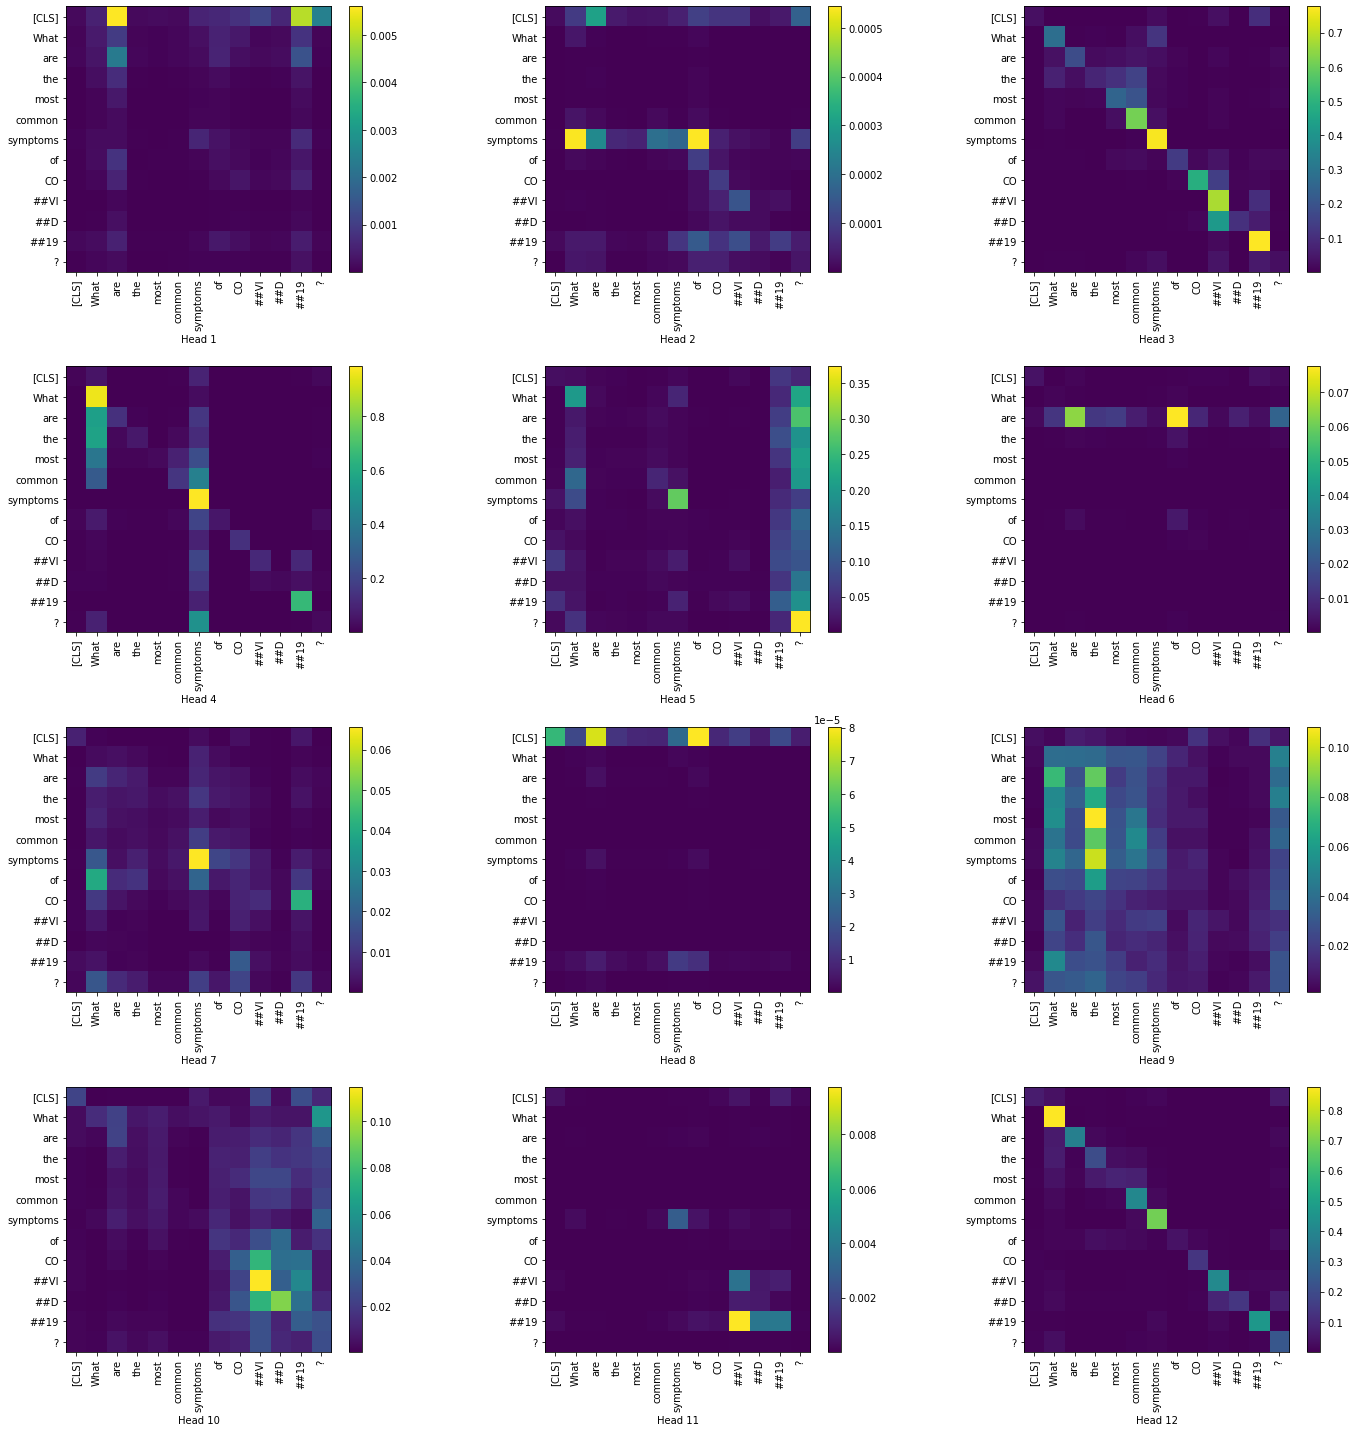
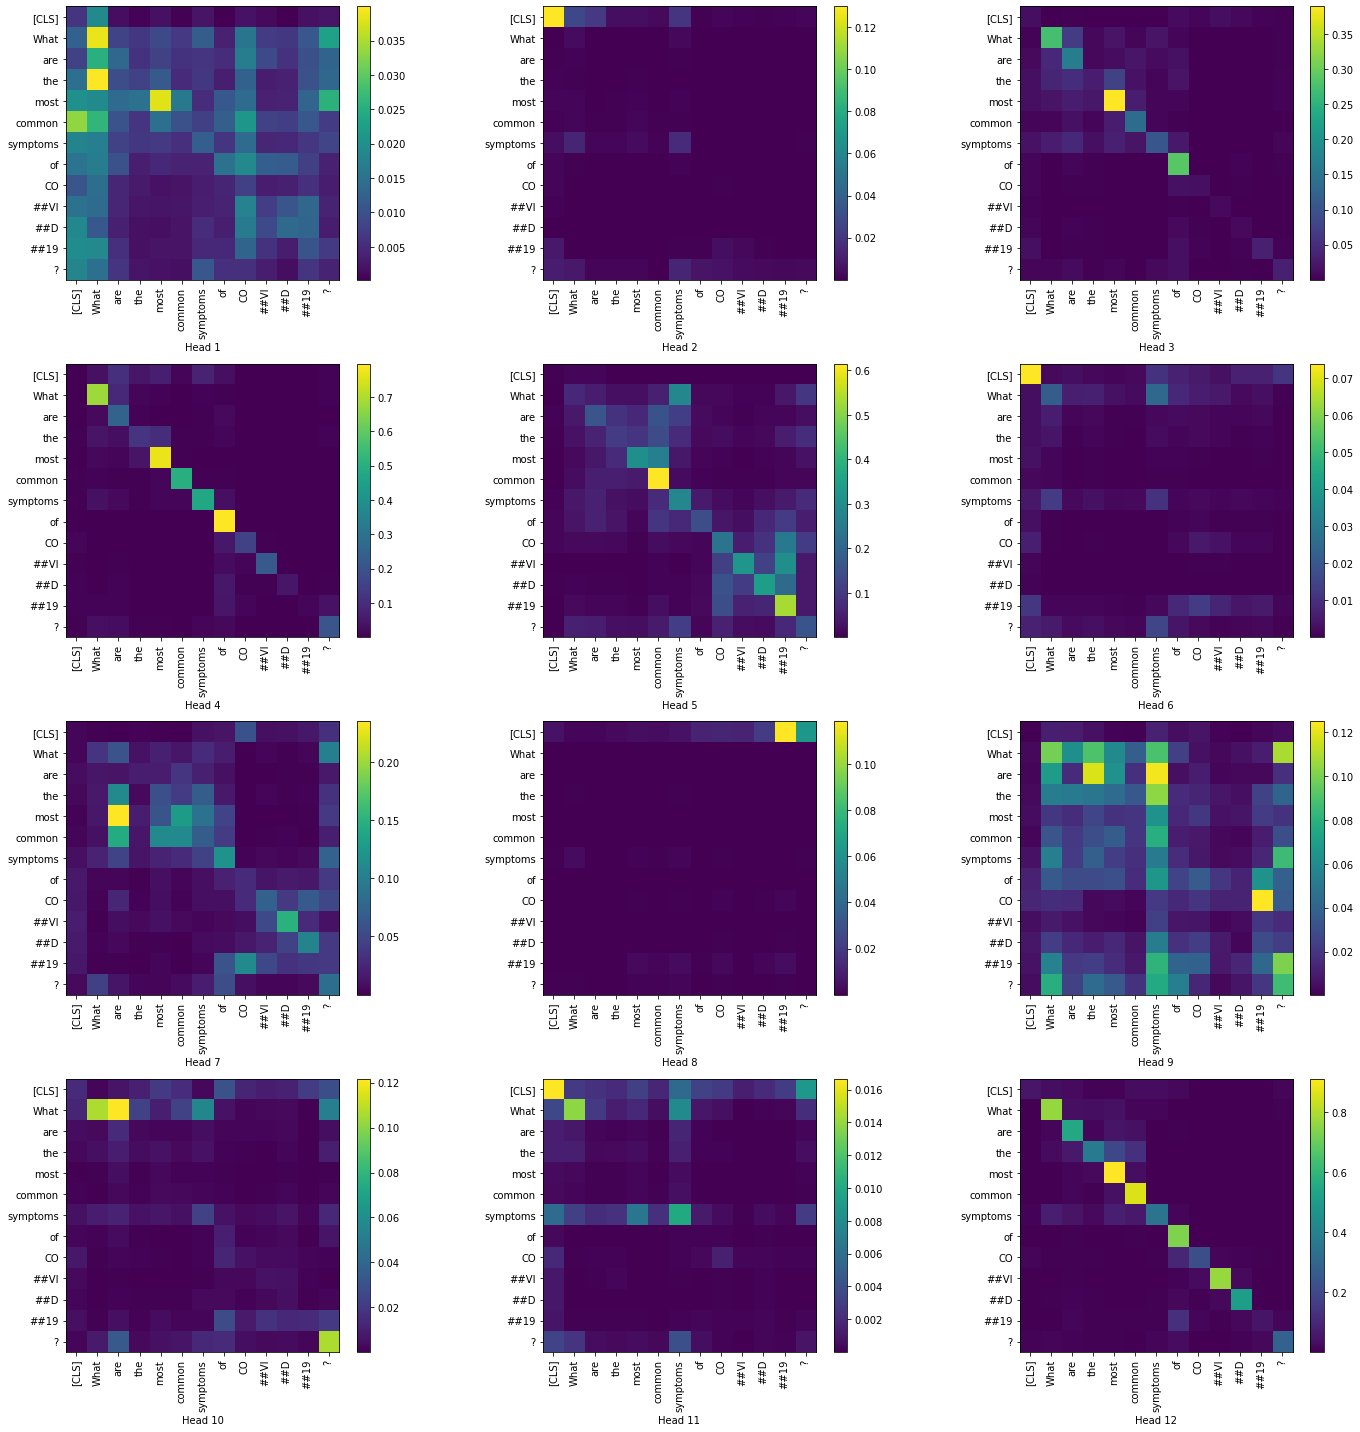
Let us examine the token-to-token attention scores for all heads in the layers 1 and 12. We have restricted to only the question tokens in order to produce a simpler visualization.
Layer 1:
|
Layer 12:
|
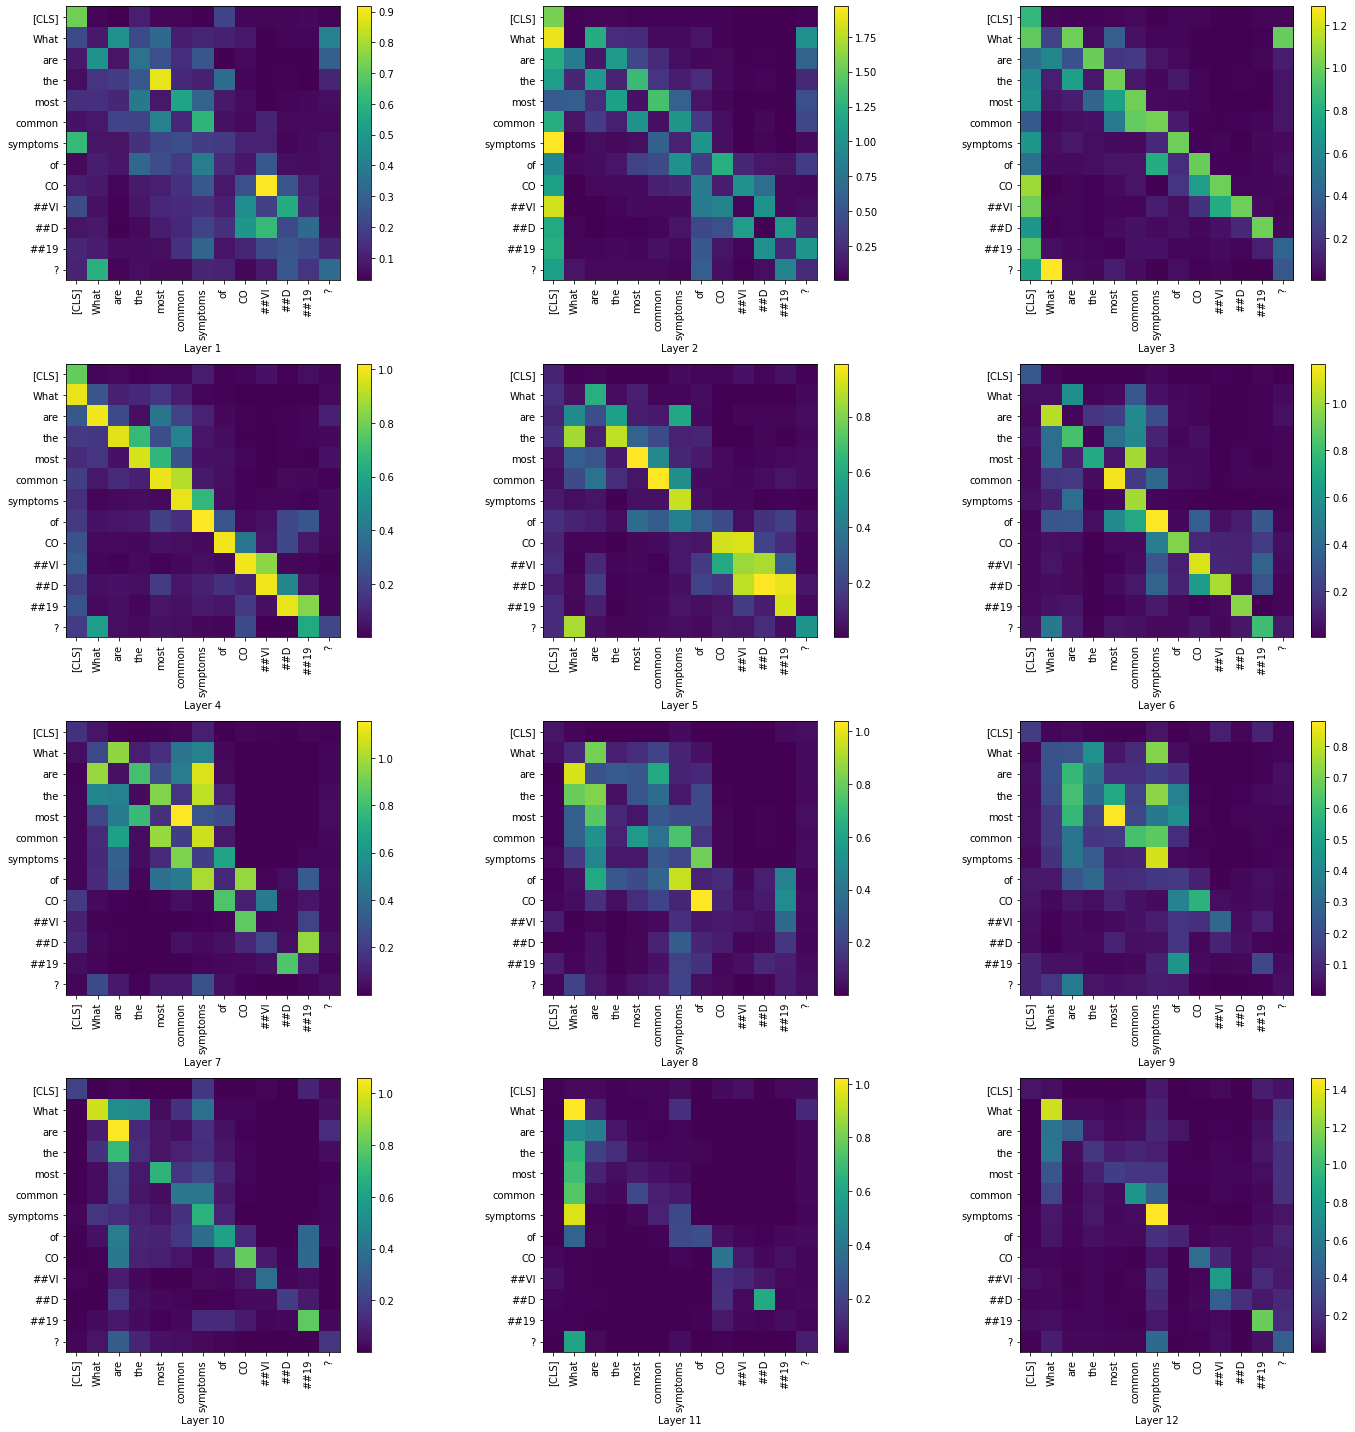
From the above visualizations, we can see the how the token-to-token attention changes as we move across the layers, particularly with heads 6,8 and 9. In most of the heads the attention is high in the [CLS] token.
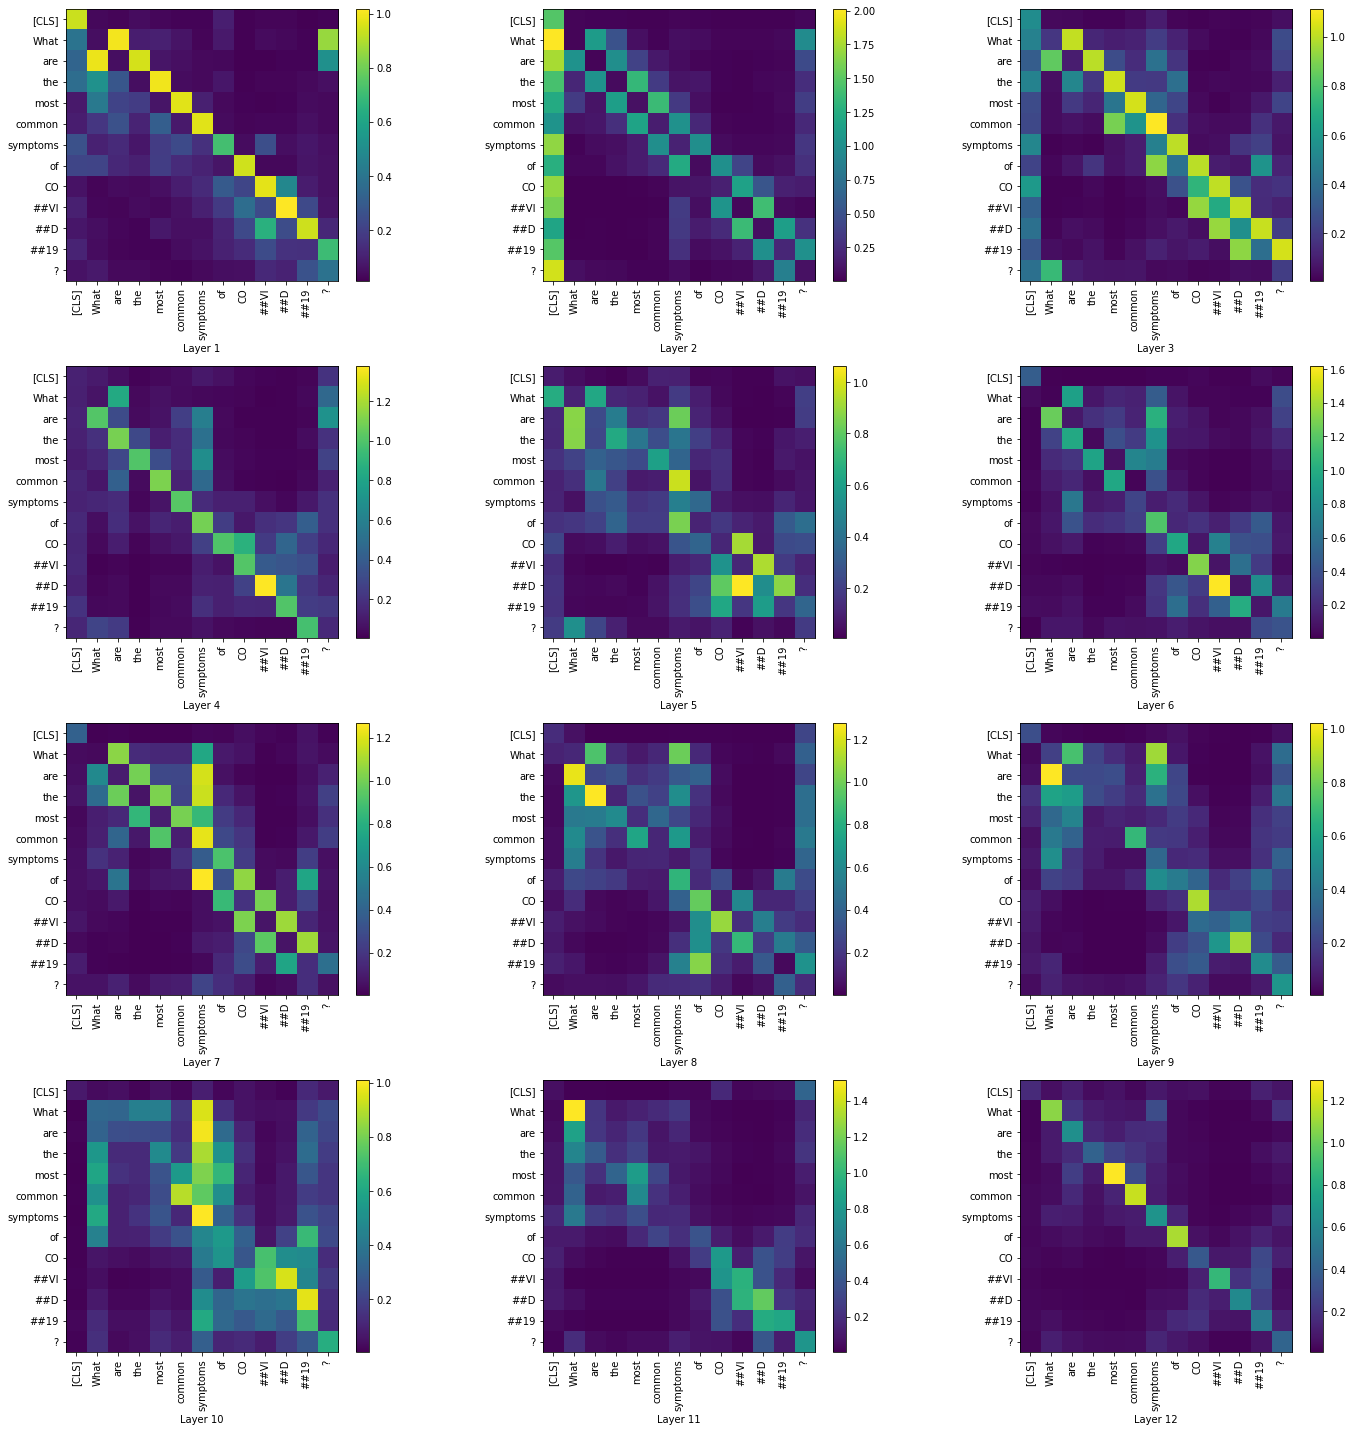
Then, we visualize the summary of each layer across all the heads,
|
4.1.2 BERT base with fine-tuning on COVID-QA
Next, we fine-tuned BERT base fine-tuned on SQuAD on COVID-QA. Let us take a look at a few examples,
Example 1
Question: What are the most common symptoms of COVID19?
Answer and METEOR Score: (20 answers predicted from the 20 contexts)
Answer in COVID-QA: Fever and cough
|
Example 2
Question: How long is the incubation time for COVID19?
Answer and METEOR Score: (20 answers predicted from the 20 contexts)
Answer in COVID-QA: between 2 and 14 days
|
|
We have contracted some answers for ease of display.
Looking at the extracted answers, we can see how the model extracted texts about incubation period from the given context. While in some cases, the extracted answer is much more longer than the answer in COVID-QA which has caused the score to be lower in such cases.
Now, let us visualize the token-to-token attention scores for all heads in the layers 1 and 12. We have restricted to only the question tokens in order to produce a simpler visualization.
Layer 1:
|
Layer 12:
|
Summarized visualization of the layers across all attention heads
|
4.1.3 BioBERT base without fine-tuning on COVID-QA
Now, let us take a look at a few examples of answers extracted by the BioBERT model that was not fine-tuned on COVID-QA
Example 1
Question: What are the most common symptoms of COVID19?
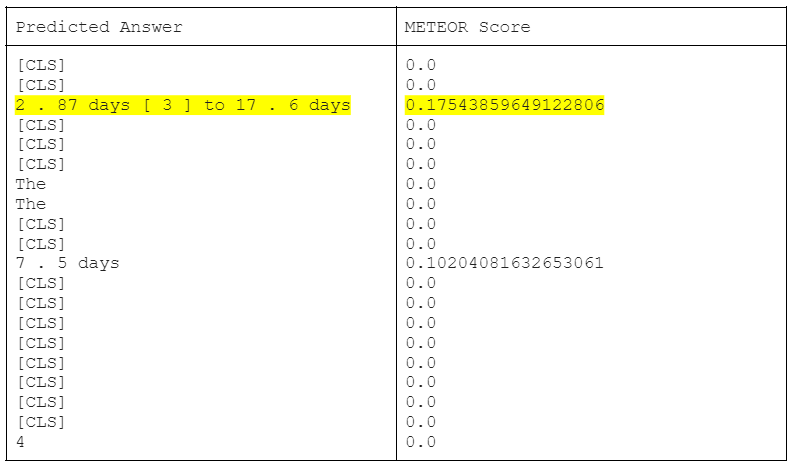
Answer and METEOR Score: (20 answers predicted from the 20 contexts)
Answer in COVID-QA: Fever and cough
|
Example 2
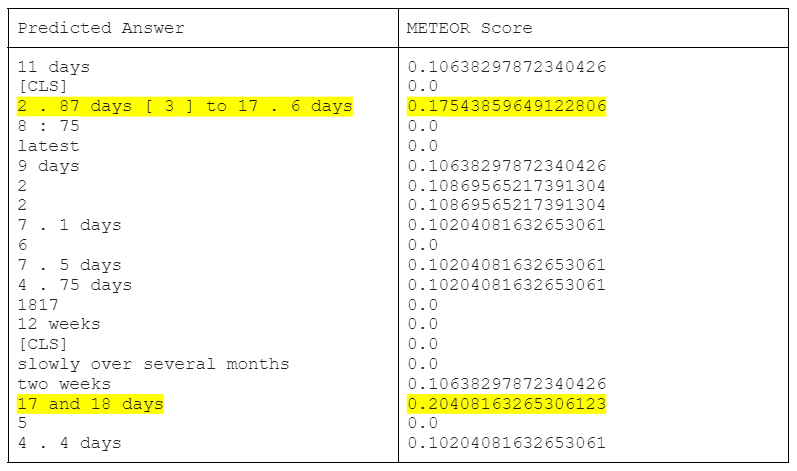
Question: How long is the incubation time for COVID19?
Answer and METEOR Score: (20 answers predicted from the 20 contexts)
Answer in COVID-QA: between 2 and 14 days
|
We can see from this example how the scores are only an indicator of correctness and they don't refelect the model performance in our case as the contexts differ from the validation data used. Based on the fed context, the model has extracted a valid answer, 2.87 days to 17.6 days
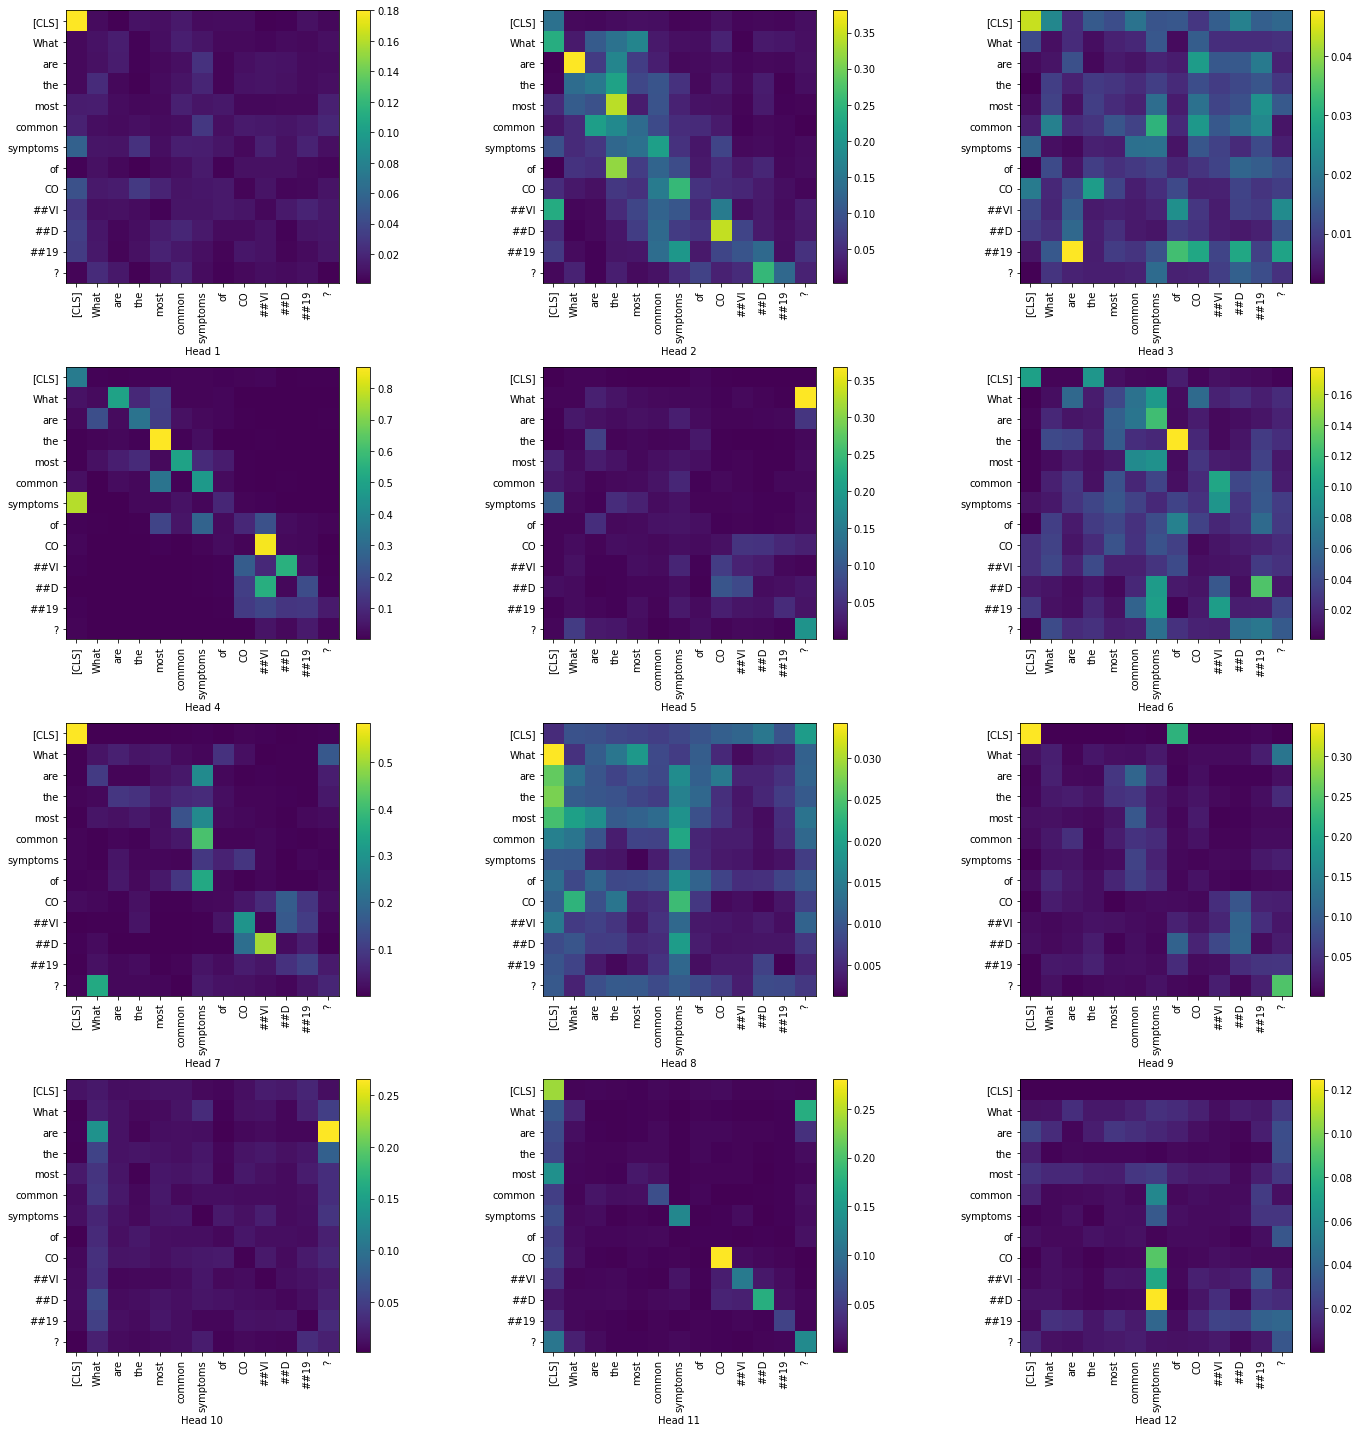
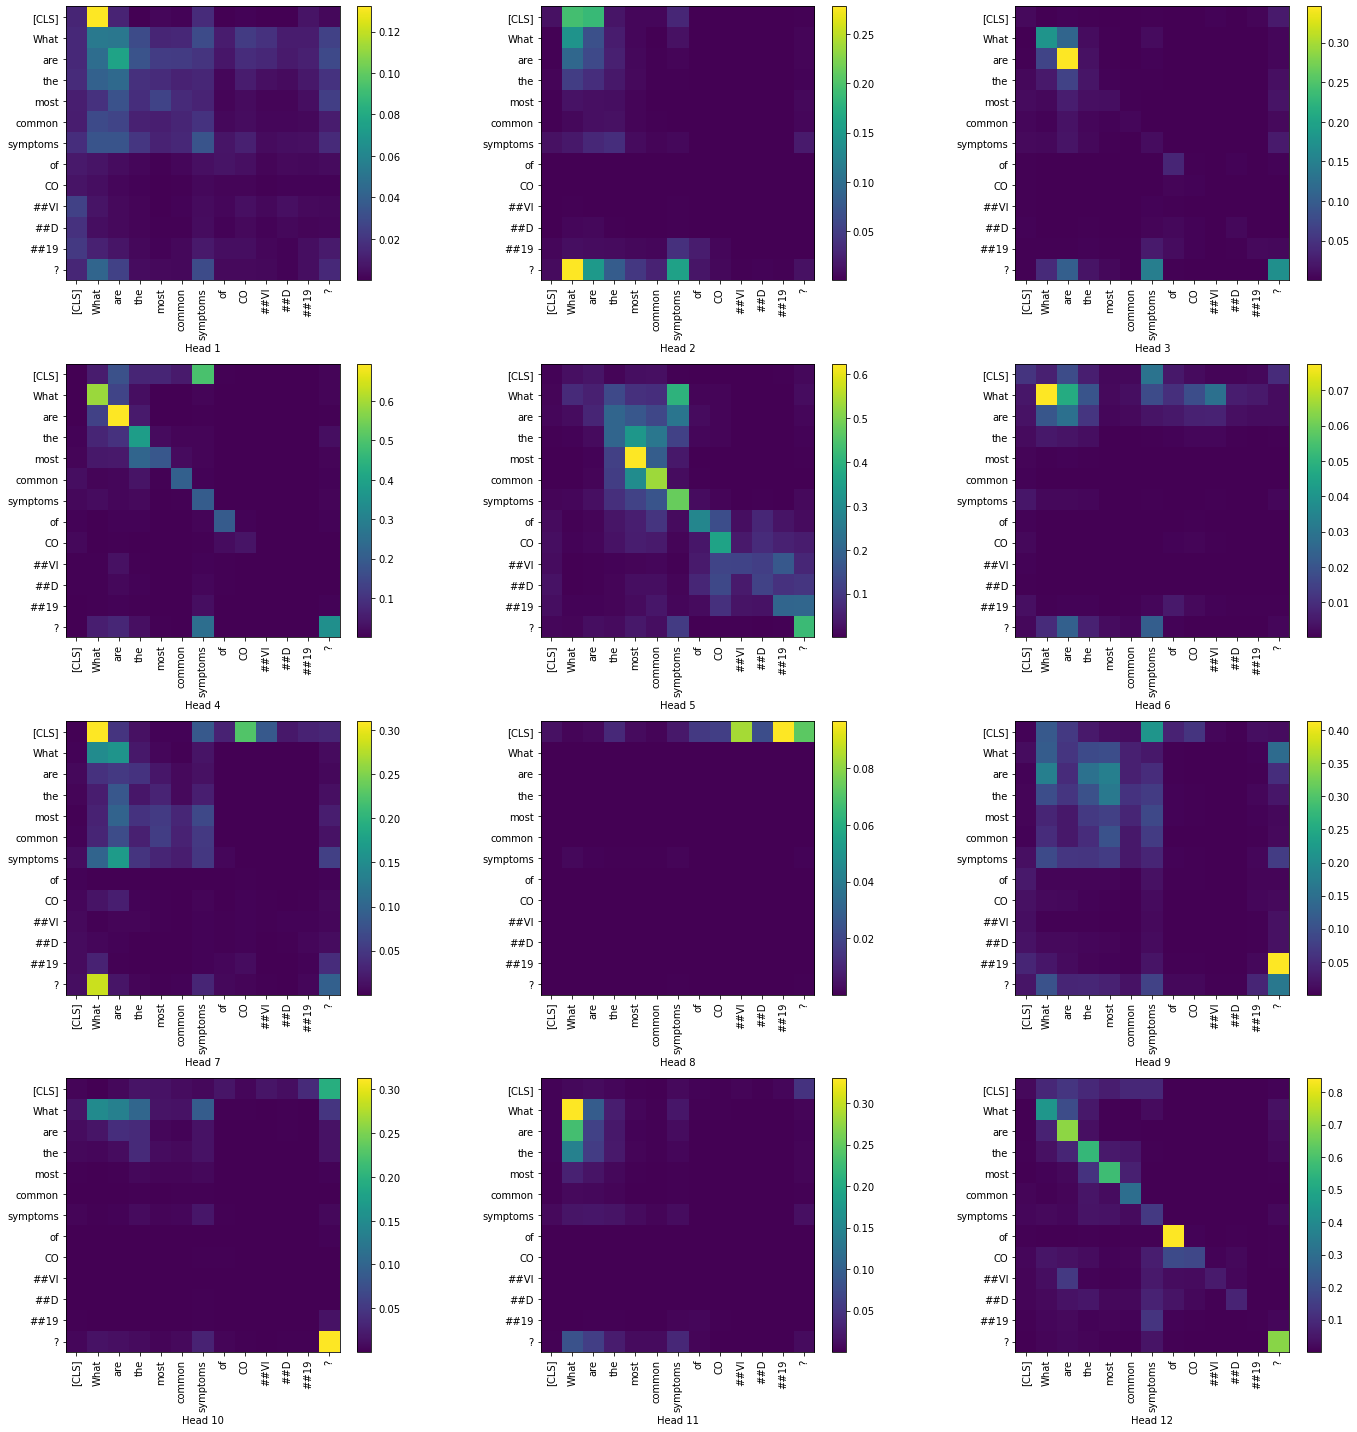
Now, let us visualize the token-to-token attention scores for all heads in the layers 1 and 12. We have restricted to only the question tokens in order to produce a simpler visualization.
Layer 1:
|
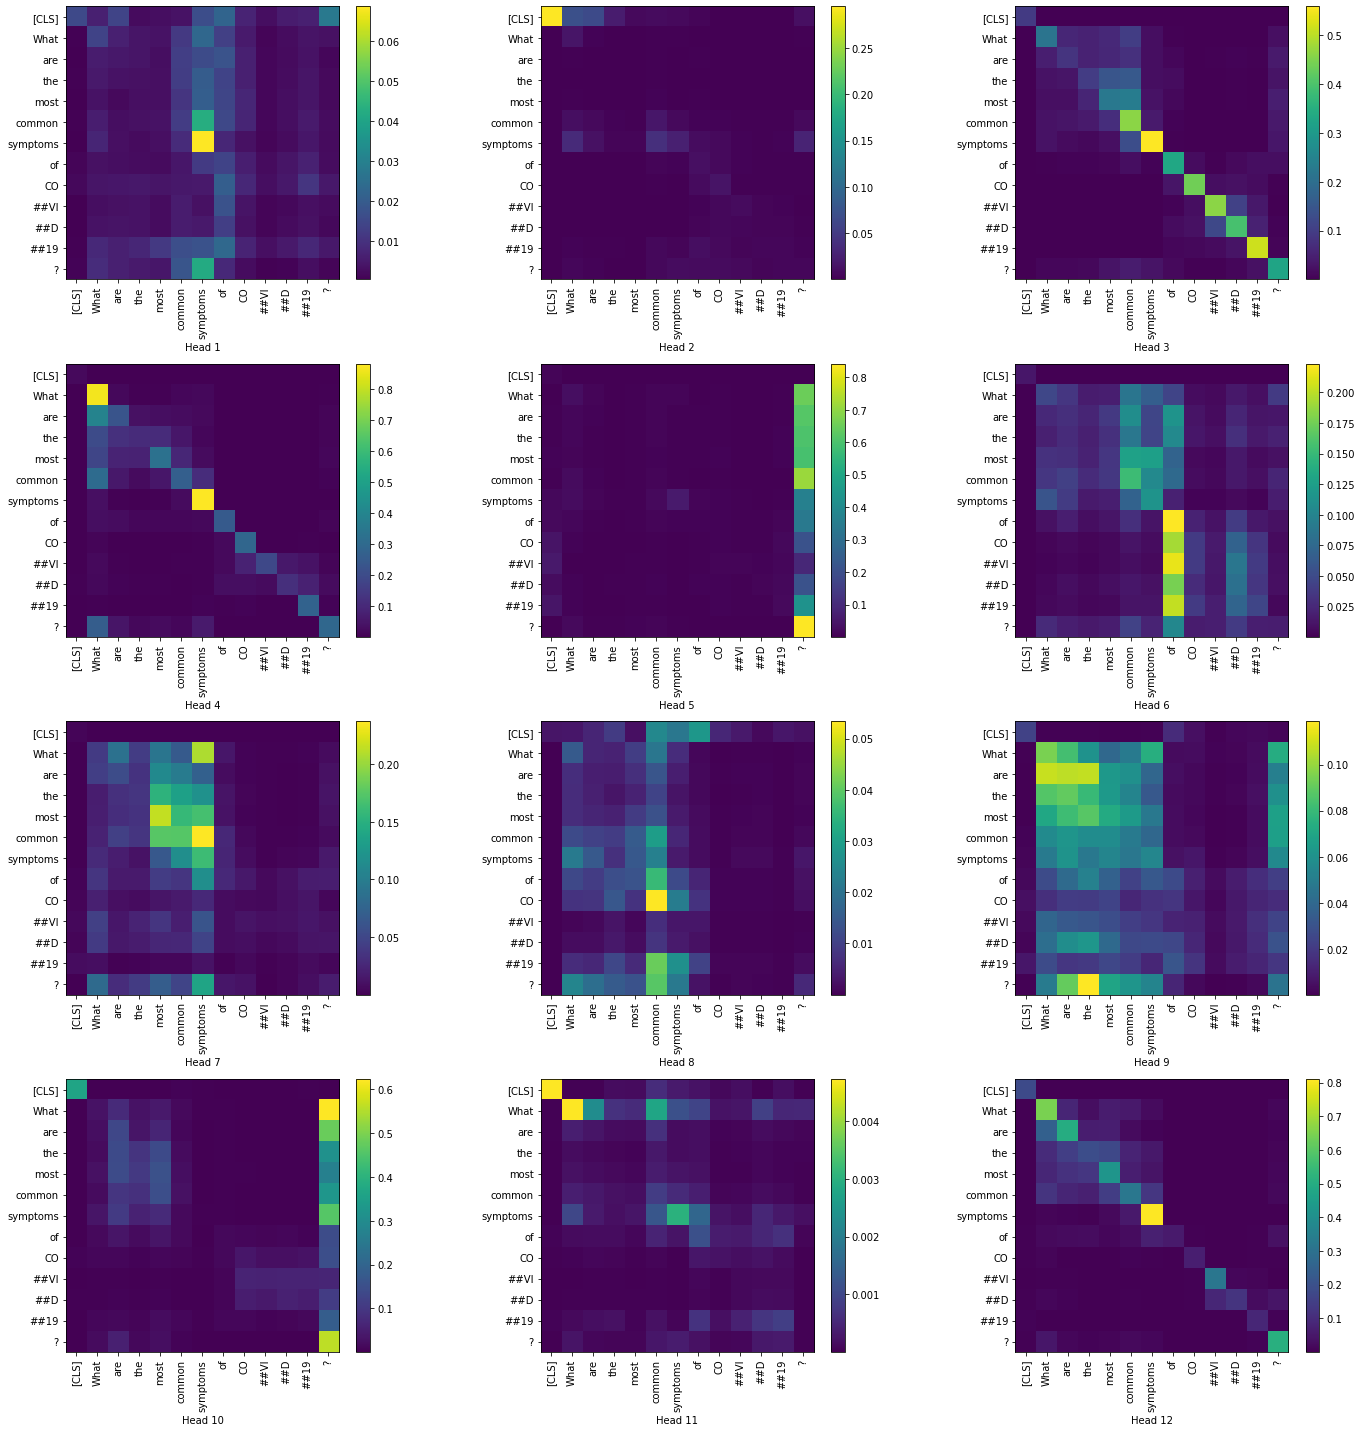
Layer 12:
|
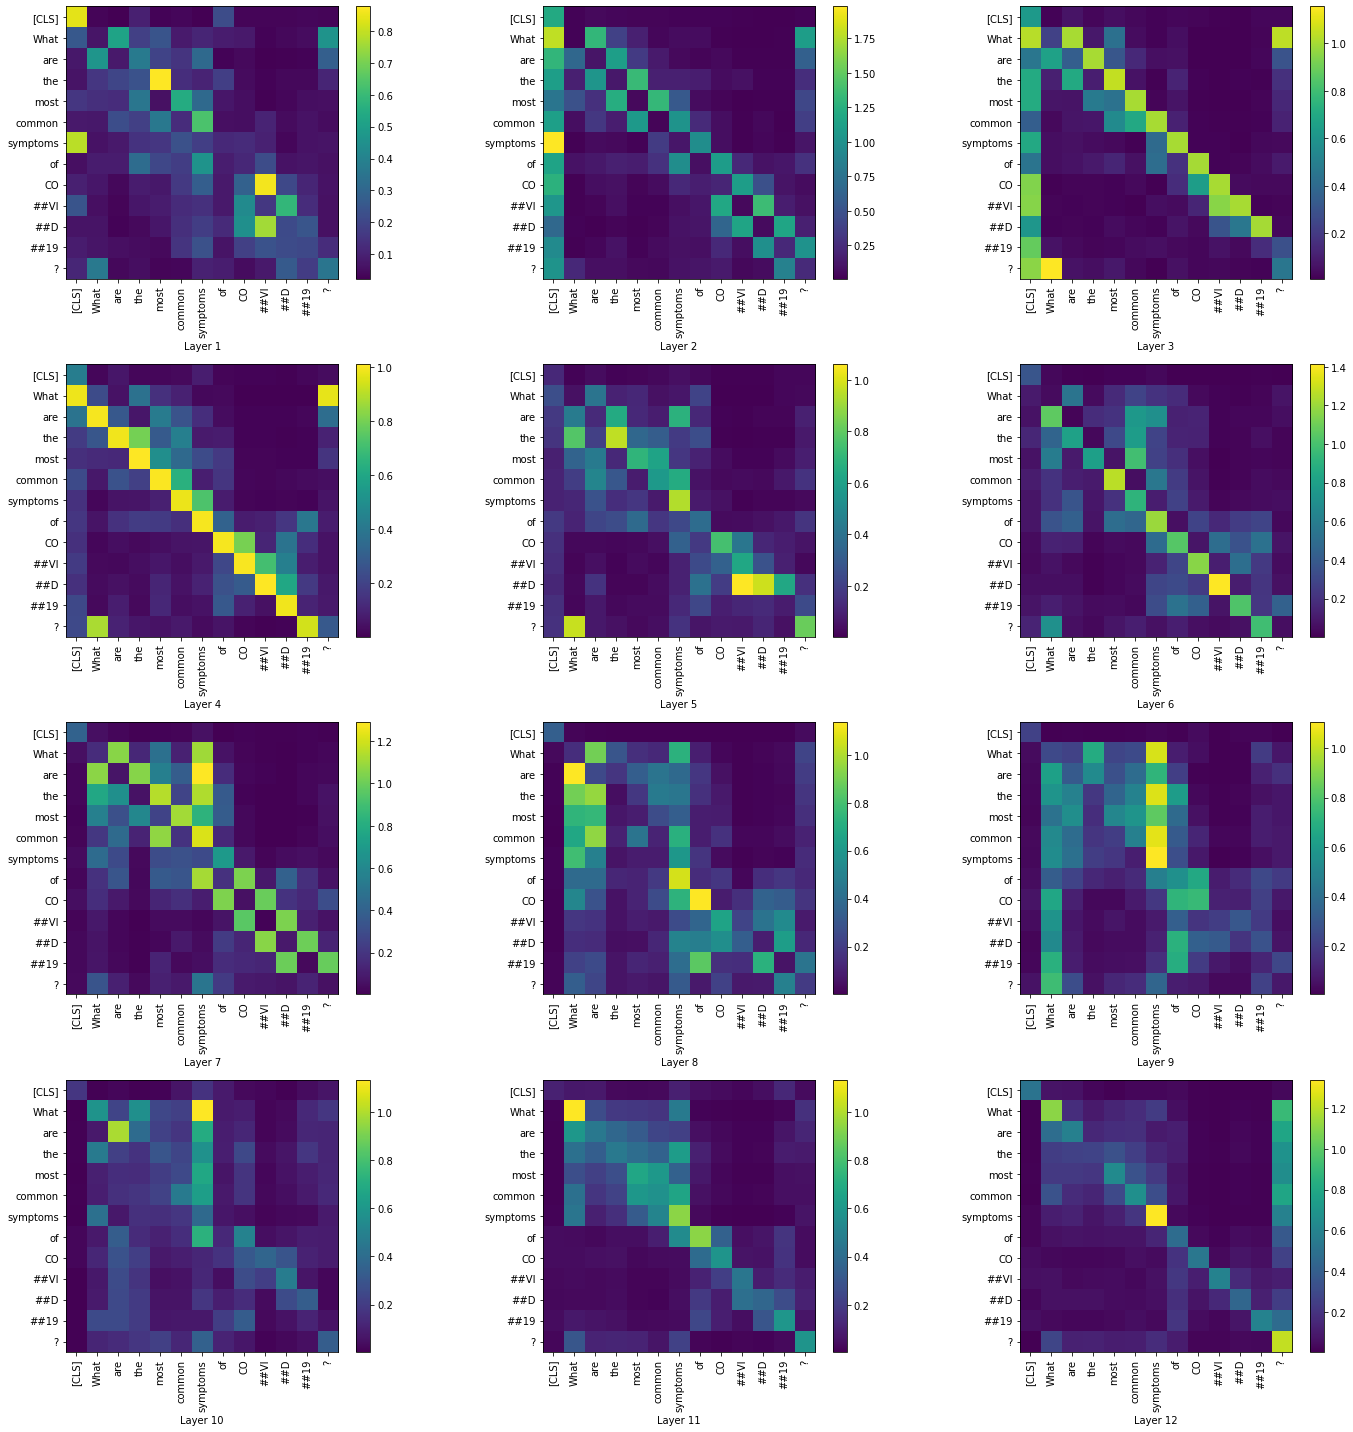
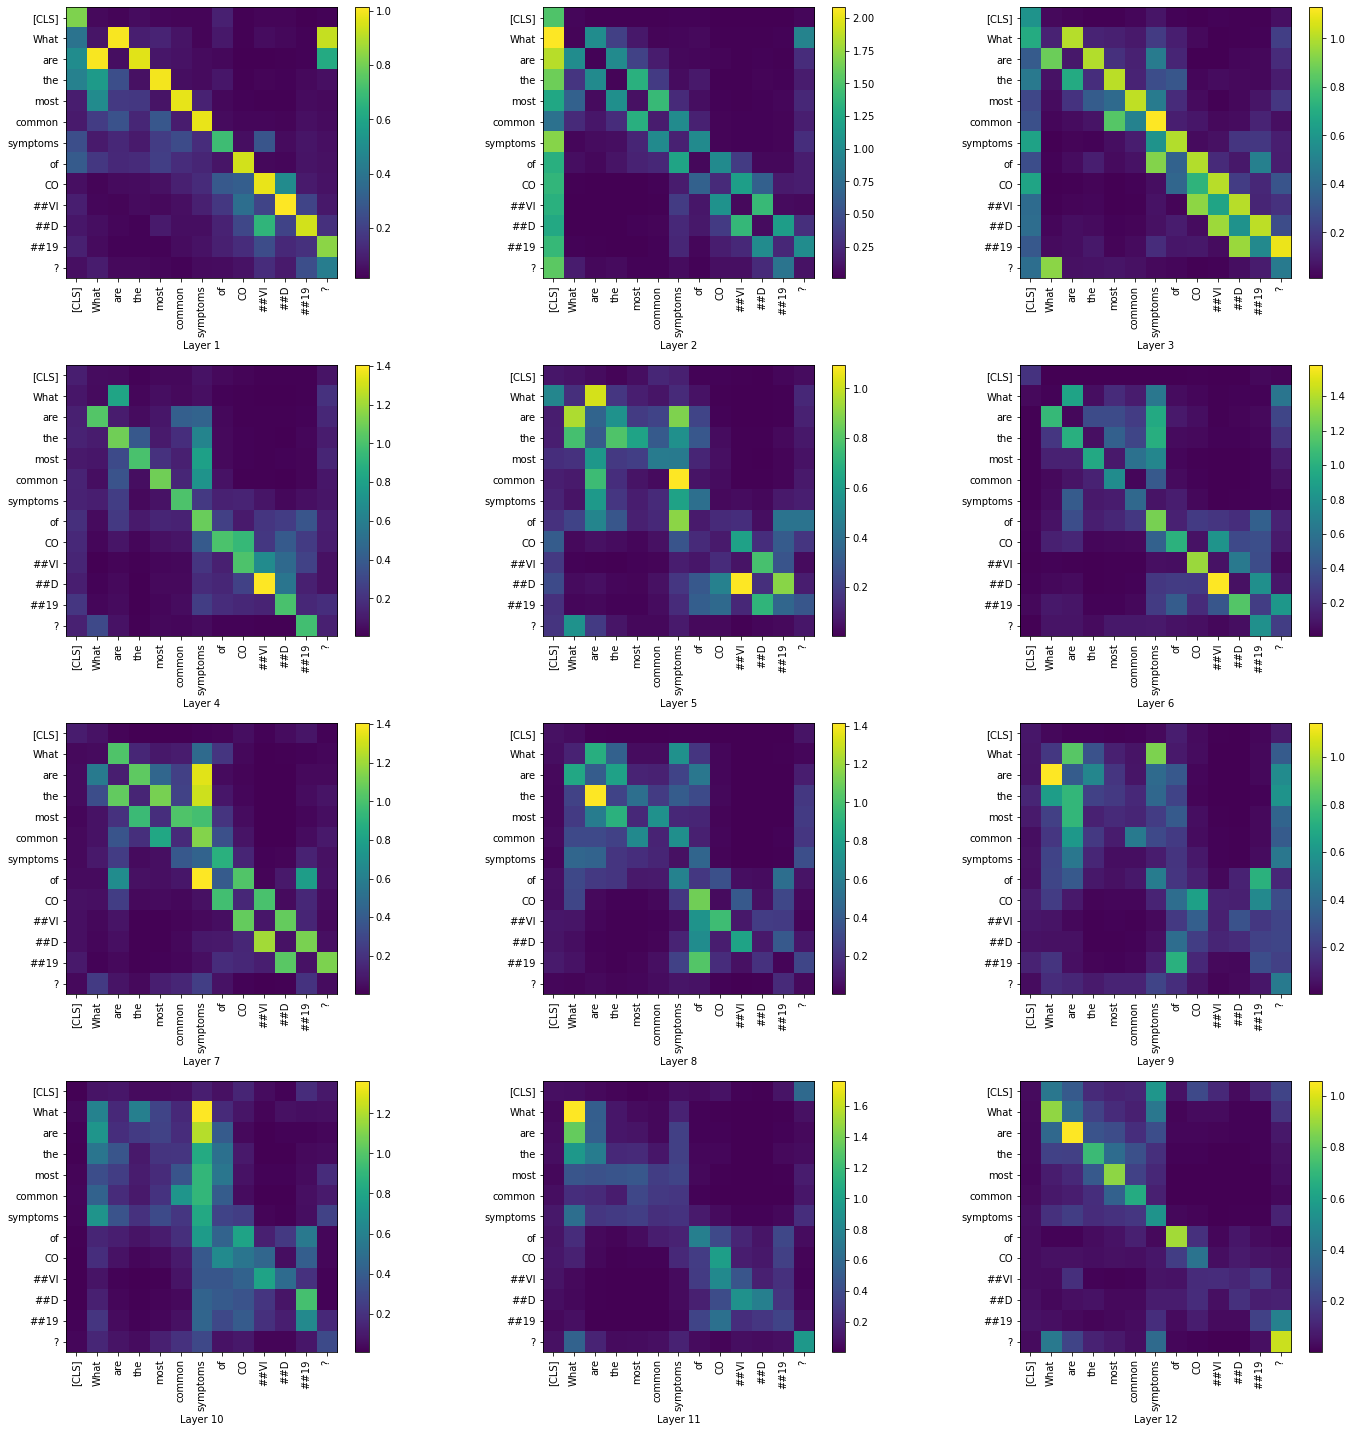
Visualizing the summary of attention matrices of all layers across all heads
|
4.1.4 BioBERT base with fine-tuning on COVID-QA
Next, we fine-tuned BioBERT fine-tuned on SQuAD on COVID-QA. Let us take a look at a few examples,
Example 1
Question: What are the most common symptoms of COVID19?
Answer and METEOR Score: (20 answers predicted from the 20 contexts)
Answer in COVID-QA: Fever and cough
|
Example 2
Question: How long is the incubation time for COVID19?
Answer and METEOR Score: (20 answers predicted from the 20 contexts)
Answer in COVID-QA: between 2 and 14 days
|
From the above examples, we can see how the BioBERT model, that is pre-trained on PubMed articles has produced more meaningful answers than the BERT Base model
Now, let us visualize the token-to-token attention scores for all heads in the layers 1 and 12. We have restricted to only the question tokens in order to produce a simpler visualization.
Layer 1:
|
Layer 12:
|
Visualizing the summary of attention matrices of all layers across all heads
|
From the predicted answers and the METEOR scores, we can see how without finetuning the models predicted [CLS] as answer in most of the cases. We can also see that BioBERT has produced more meaningful answers to the questions after fine-tuning.
While the visualizations help us understand how the attention mechanism changes between the layers, we were not able to arrive at a conclusion only based on the question tokens. In the summary visualizations of all four cases, we see high attention along the diagonals of the matrices. Visualizing across the contexts would probably give us a better insight regarding the attention mechanism.
4.2 EM score, F1 score and attention visualization
Here, we have evaluated BERT and BioBERT as QA models on two datasets - COVID QA and DROP QA. We measured the EM/F1 scores and visualized the attention matrices for one of the questions.
Exact Match (EM) shows the number of tokens that match between the predicted answer and the ground truth answer. F1 score is computed as (2 * precision * recall) / (precision + recall) where precision = number of common tokens / number of predicted tokens and recall = number of common tokens / number of ground truth tokens
We repeated the steps described in 4.1 for both models before and after fine-tuning on COVID-QA and DROP-QA respectively. We fine-tuned the models on each dataset for 3 epochs.
4.2.1 On COVID-QA
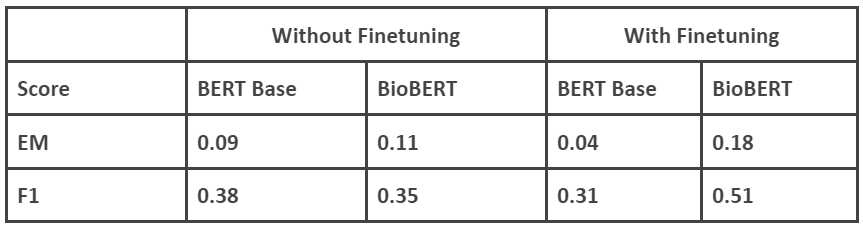
|
4.2.2 On DROP-QA
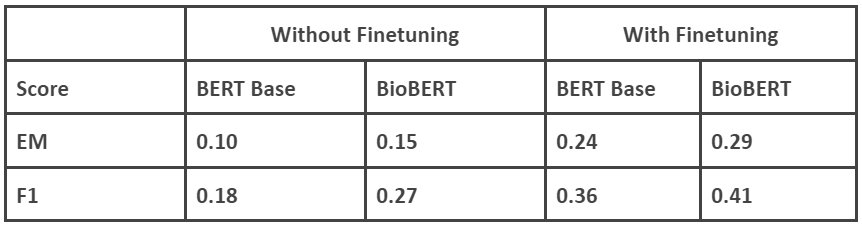
|
Fine-tuning here refers to fine-tuning on COVID-QA/DROP-QA datasets. The models are already fine-tuned on SQuAD before we do another fine-tuning on the respective datasets
We can observe that in 3 out of the 4 cases, finetuning (on respective datasets, in addition to the SQuAD finetuning) has increased accuracy and the F1 score of the BioBERT model is higher in case of COVID-QA than DROP-QA. One other aspect we need to consider is the size of the dataset. DROP-QA is a huge dataset so we have used only a sample of the dataset. When we initially performed the experiment, the fine-tuned BERT Base model produced lower scores than the model without fine-tuning. Suspecting overfitting, we increased the sample size used for fine-tuning and the accuracy with fine-tuning increased. We are now observing a similar case with COVID QA and BERT Base. But COVID-QA is a dataset of limited size, 2019 questions and answers. So we did not make any changes to the training or fine-tuning.
The visualization of attention matrices are available in this notebook. We were not able to arrive at a conclusion only based on the question tokens. Visualizing across the contexts might give us a better insight regarding the attention mechanism of the models.
5 Is Accuracy everything!
5.1 Background
Whenever it comes to solve a problem using AI, we always focus on the model, how much accuracy it is giving and how good it is when compared to other model results. If any model needs more computation then we try to get that computational power without thinking about the things happening in the background. The computational power is generated by some renewable or non renewable resource, and the more we use up those without replenishing it, the more we are making AI models become part of the global warming, instead of using AI models to save the world we might actually end up making it worse. Training a single AI model can emit as much carbon as five cars in their lifetimes [17]. While looking at the accuracies we miss out on considering a key factor computational resources. Based on the problem at hand we can probably settle for a lesser accuracy with lower computational requirement, for example Driverless car we would require 100% accuracy because, if not it might lead to serious accidents. But in the case where we are trying to predict an answer or wearther it is fine if we have lesser accuracies and consider a small margin of error, in predictions.
In this experiment we work with Question Answering dataset consisting of 2,019 question/answer pairs annotated by volunteer biomedical experts on scientific articles related to COVID-19, present as part of huggingface database [18]. We randomly pick 203 questions from this database. We select different varities of BERT models to understand how different models work, and how much power each takes and how much accurate the models are. The following are the models:
- Longformer Model :
- BioBERT
- DistilBert
- ELECTRA BERT
- AlBert
- BERT-Large
Initially all the BERT models had to work with sequence of 512 words, in that scenario it was missing lot of relationships between words or sentences. Longformer increased the sequence length to 2048 and 23040 ( smaller and longer ). The self-attention calculation was modified to reduce the model complexity for such large sequences. We used a Longformer pretrained on the above dataset with sequence length of 2048 words. Hypothesis is it would give good enough accuracy due to longer sequences but will take more power due to complex calculations of large sequences.
Domain-specific language representation model pre-trained on large-scale biomedical corpora. This BERT model is trained to identify biomedical terms and assumption is that it should perform good with respect to the above COVID dataset.
DistilBERT is a small, fast, cheap and light Transformer model trained by distilling BERT base.DistilBert learns a distilled version of BERT, retaining 97% performance but using only half the number of parameters (paper). Specifically, it does not has token-type embeddings, pooler and retains only half of the layers from Google’s BERT. DistilBERT uses a technique called distillation, which approximates the Google’s BERT, i.e. the large neural network by a smaller one. The idea is that once a large neural network has been trained, its full output distributions can be approximated using a smaller network.
ELECTRA model introduced a new approach to training that produces a model with comparable (and often better) performance than even the best transformers and required just a fraction of the compute power. Unlike its predecessors that relied on MLM pre-training — ELECTRA uses a more efficient approach called ‘replaced token detection’. Rather than masking a random selection of input tokens — this approach uses another neural network that attempts to trick our model by replacing random tokens with fake tokens. The approach is similar to that employed by GANs. When training GANs, we pit two networks (the generator and discriminator) against each other. The generator is optimized to ‘trick’ the discriminator with increasingly convincing (but nonetheless fake) data. Our discriminator is then left to identify what is true and what is false data generated by the generator model. ELECTRA applies a similar approach. Our model is the discriminator, which is tasked with identifying which tokens are genuine and which are fakes that have been placed there by the generator.[20]
ALBERT stands for A Lite BERT and is a modified version of BERT NLP model. It builds on three key points such as Parameter Sharing, Embedding Factorization and Sentence Order Prediction (SOP).
BERT is based on stacked layers of encoders. The difference between BERT base and BERT large is on the number of encoder layers. BERT base model has 12 encoder layers stacked on top of each other whereas BERT large has 24 layers of encoders stacked on top of each other. BERT large increases the performace of BERT base further, but at the cost of computational power.
5.2 Results
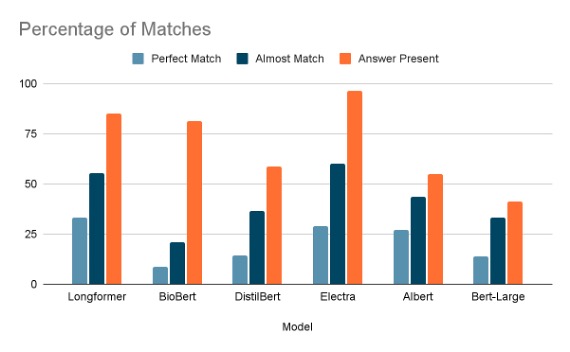
We used the above 6 pretrained models to identify the Answer for 203 Questions from the covid_qa_deepset dataset in huggingface [18]. There are three metrics we calculated namely:
- Matching Accuracy :
- Perfect Match :
- Almost Match :
- Answer Present :
- Anwer Not Present
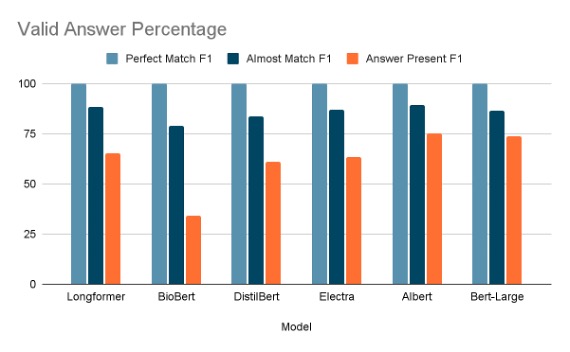
- Amount of Match Accuracy:
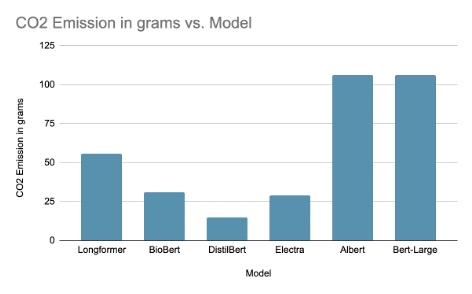
- CO2 Emmissions:
In matching accuracy we identify the number of matches each model was able to identify. We divide the matches further into 4 categories
When the answer generated by the model matches word by word with the expected anwer. Only contains exact matches.
When the answer generated by the model has less than 0.5 noises added, along with the answer. Contains Perfect Match count along with this count.
When the answer is present in the result, but there are too many noises appended to it than what is expected. Contains Almost Match count along with this.
When the expected answer is not present in the predicted answer.
For each of the above matches we this metric tells how much of the predicted answer is part of the expected answer.
Amount of CO2 emitted during the run to find answers for 203 questions.
|
|
|
We can take DistilBert, Longformer and Electra for comparision here. We can see that the Electra model released half the amount of CO2 released by Longformer and DistilBert released 1/4th of the Longformer model. Now when we compare this with the matches graph we can see that, Electra is performing almost as much better as longfromer and in case of almost match Electra is doing a better job than Longformer at half the power requirement. And if there is a scenario where we are okay not to get answers, but want to give power consumption more priority the DistilBert also performs good enough. Even though the common accuracy is less, we see that almost accuracy is a good metric to make the model stop training or help in choosing the model.
6 Conclusion
We utilized two BERT models that were finetuned on SQuAD, BERT base and BioBERT to build an Extractive Question Answering system. In the process, we explored two different methods of building a QA system, one where we used a retriever-reader architecture to get the contexts from which we extract answers. Another method was to directly use a SQuAD format dataset.
While we used the idea of a retriever-reader architecture for COVID-QA from the cited research paper [1], we added a comparison between BERT and BioBERT. In addition, we also visualized the attention matrices of the models. In this experiment, we observed with the help of a few examples how finetuning on COVID-QA helped both the models in producing better results. We also observed how BioBERT produced more meaningful answers with COVID related questions. In addition, we also built a QA system where we had used the SQuAD format datasets where we measured the EM and F1 scores of the models before and after finetuning on each dataset. While we visualized the attention matrices in all cases, we were not able to arrive at a conclusion based on the question tokens. Visualizing across the contexts might give us a better insight regarding the attention mechanism of the models.
We should start looking at solving problems using Deep Learning using Almost accuracy instead of just accuracy. The almost accuracy will cover the computational power requirements, how much accuracy is expected to be good in a field, etc. Considering the problem at hand hollistically instead of just considering or trying to always get behind making the accuracy better.
Instead of chasing marginally better accuracy each time, we should be considering the application in a holistic view. The increase in accuracy might be 0.01%, but would cost heavily for energy consumption, we should start questioning is it worth it? Is having less accuracy in the solution creating a large impact?
References
[1] Devlin, J., Chang, M., Lee, K., Toutanova, K., BERT: Pre-training of Deep Bidirectional Transformers for Language Understanding, 2018
[2] The COVID-19 Open Research Dataset (CORD-19) on Kaggle, 2022(updated version)
[3] Blog post titled "Question answering" on Hugging Face
[4] Blog post titled "Question Answering with a Fine-Tuned BERT" by Chris McCormick, 2020
[5] Documentation of "Tokenizer" on Hugging Face
[6] Wu, Y., et al., Google's Neural Machine Translation System: Bridging the Gap between Human and Machine Translation, 2016
[7] Rajpurkar, P., et al., Stanford Question Answering Dataset, 2016
[8] Alzubi, J., et al., COBERT: COVID-19 Question Answering System Using BERT, 2021
[9] Lee, J., et al., BioBERT: a pre-trained biomedical language representation model for biomedical text mining, 2019
[10] MÖller, T., et al., COVID-QA: AQuestion Answering Dataset for COVID-19, 2020
[11] Blog post titled "Metric: meteor" on Hugging Face
[12] Documentation of "sklearn.feature_extraction.text.TfidfTransformer" on scikit-learn
[13] Documentation of COVID QA dataset on Hugging Face
[14] Documentation of DROP QA dataset on Hugging Face
[15] Documentation of Captum interpretability library
[16] Clark, K., et al., What does BERT look at? An Analysis of BERT's Attention, 2019
[17] Blog about how transformer models take up energy equivalent to cars.
[18] covid_qa_deepset
[19] Energy and Policy Considerations for Deep Learning in NLP
[19] ELECTRA is BERT — Supercharged
Code Links
- COVID-19 Question-Answering System with BERT and BioBERT
- Out-of-domain Question-Answering with BERT and BioBERT